New feature: Paginated report and dashboard support
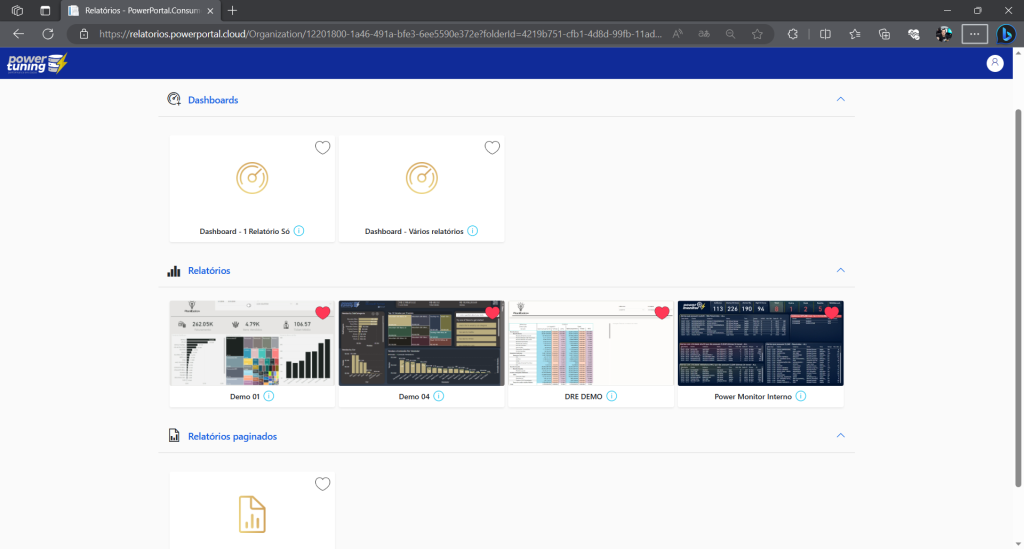
Today we are celebrating a huge evolution in Power Embedded: Support for paginated reports and dashboards!
What is paginated report and dashboard?
Paginated reports are designated to be printed or shared. They are called paginated because they are formatted to fit well on a printed page. They display all the data in one table, even if the table spans multiple pages. You can control the layout of the report page exactly. (See more about the paginated reports in this link here)
Dashboards are a great way to monitor your business, find answers, and see your most important metrics at a glance. Visualizations on a dashboard can come from one or more underlying datasets or reports. A dashboard can combine on-premises and cloud data, which provides a consolidated view no matter where the data resides. (See more about dashboards in this link here)
A dashboard isn't just a pretty picture, it's an interactive canvas. Blocks are updated as the underlying data changes.
In addition to traditional reports, Power Embedded now also supports paginated reports and dashboards.
How the paginated report and dashboard works in the Portal
The paginated report and dashboards import process follows the same steps as for importing a regular Power BI report:
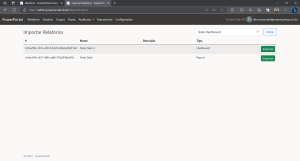
- On the Reports screen, click on the “Import” button
- Select the desired workspace
- From the list of workspace items, select the item you want important, whether it's a report, paginated report, or dashboard
- Click the import button
- Assign permissions to users on this report
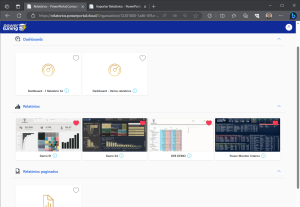
The visualization of the reports has the separation of the items by the type of visualization:
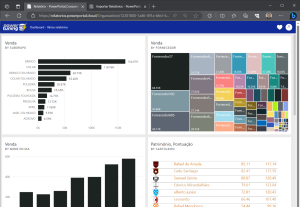
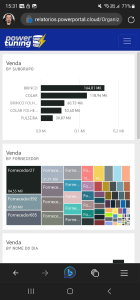
Here's how the visualization of a dashboard built with several visuals from different reports looks:
And of course we made the dashboard responsive:
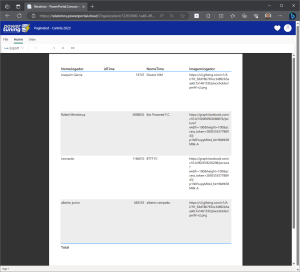
And see how the paginated report looks on the portal:
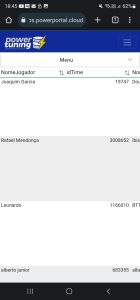
And the paginated report on mobile:
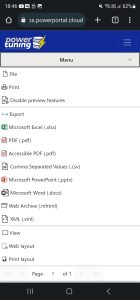
And even on mobile phones, we can use the menu to export the file in different formats:
Espero que gostem dessa atualização 🙂
One Response
No caso onde o relatório paginado está incorporado no Relatório do Power BI, utilizando o visual nativo “Relatório Paginado”, a integração não funciona.