 For users to access reports through the preview portal, you must import them through the admin portal and assign permissions on the imported report.
The process of creating and publishing the report remains the same: Report creators use Power BI Desktop to create and publish the reports and configure the Gateway (if needed) and data updates.
After that, just import the report to the visualization portal. Your customers will be able to access the report without needing a Power BI Pro license.
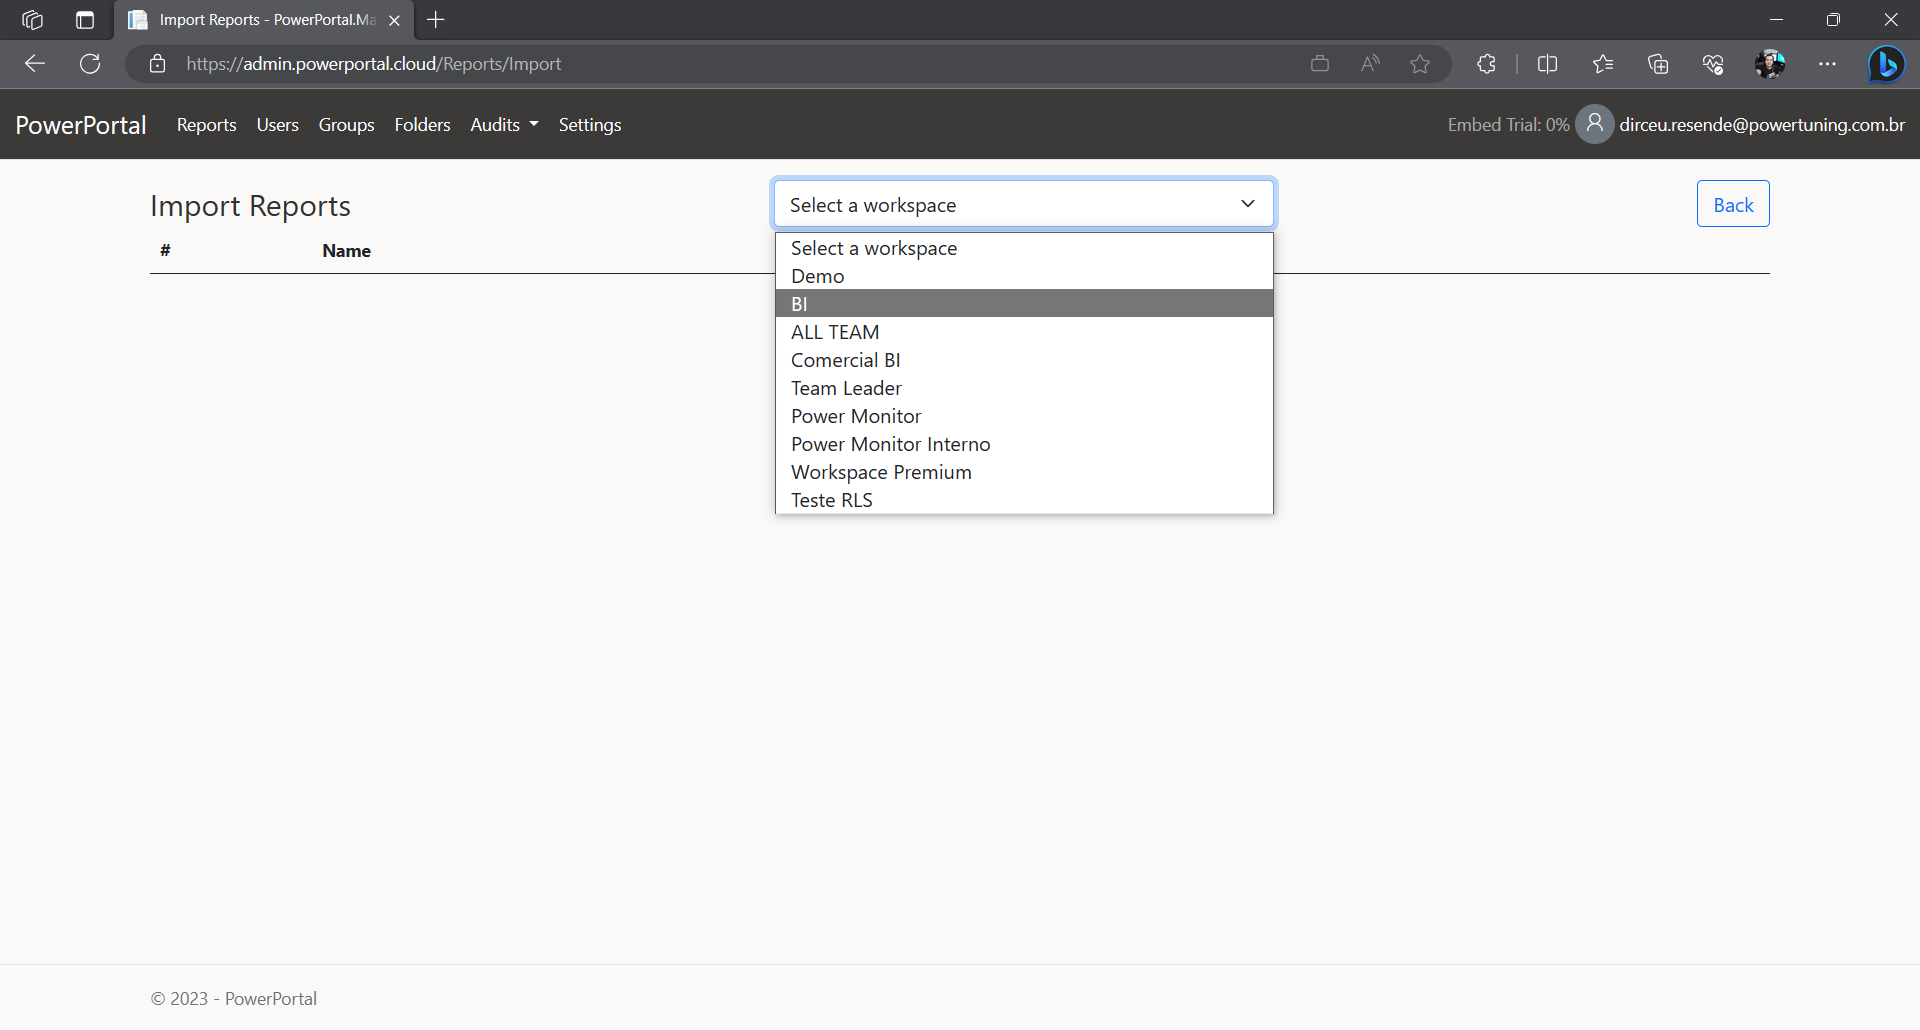 To import the reports, just select the workspace where the report is in this dropdown.
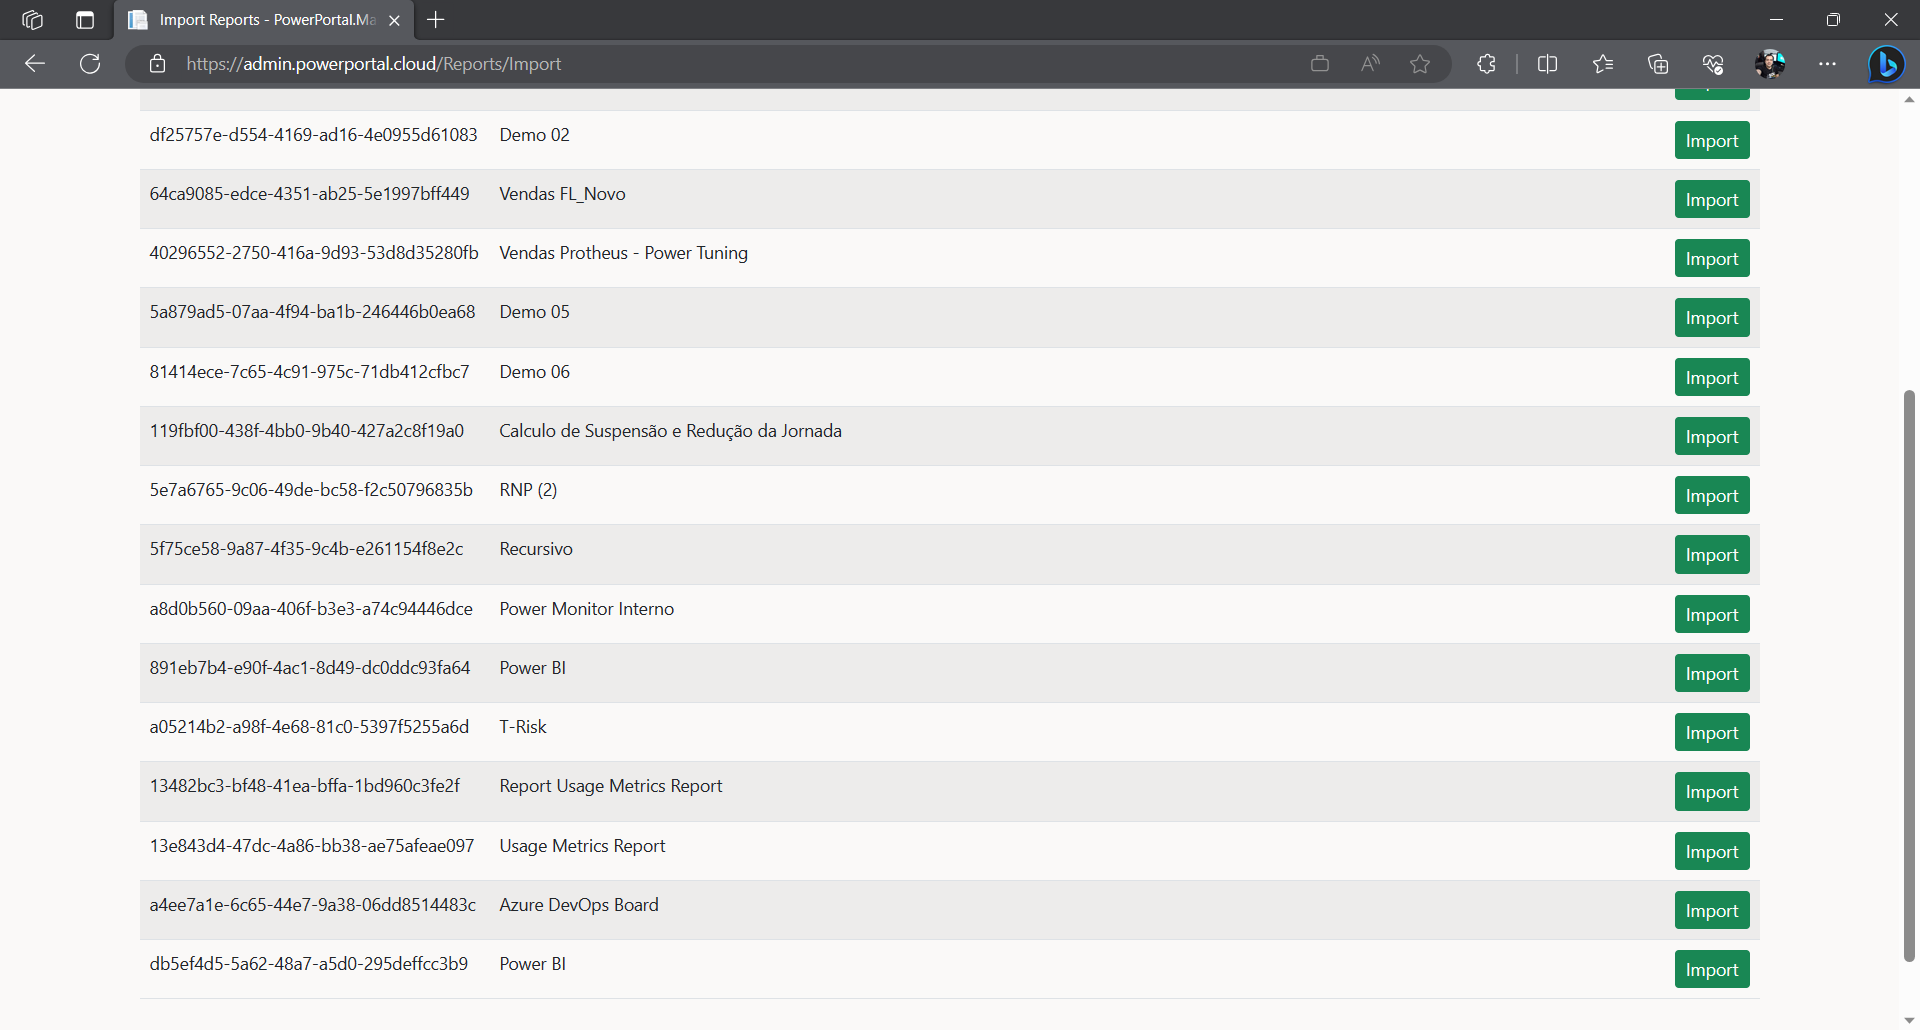 A list of reports for this workspace will be loaded.
Click on the “Import” button next to each report to import it into the Administration Portal.
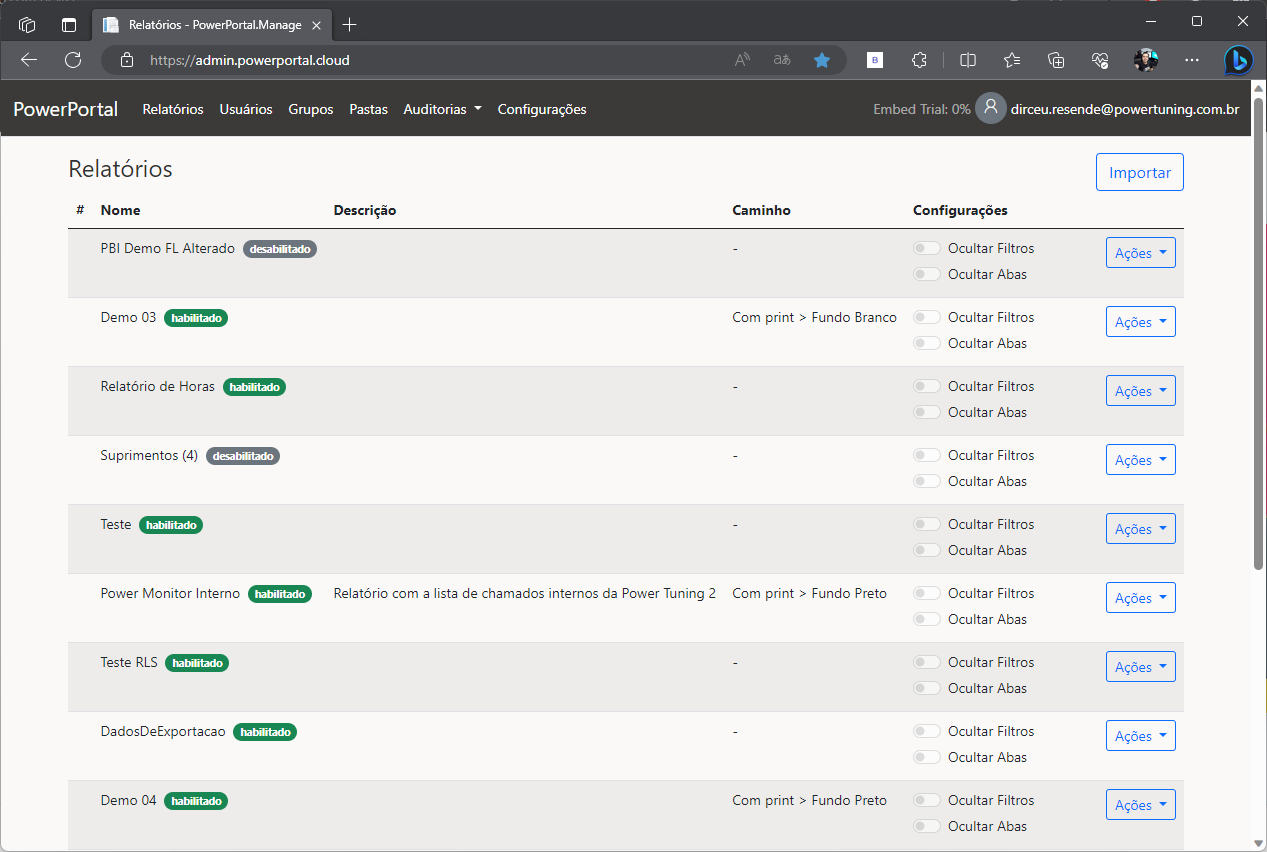
Go back to the reports list to assign the users and groups that will be able to access the report, define the RLS roles to filter the data, define in which folder this report will be located and much more.
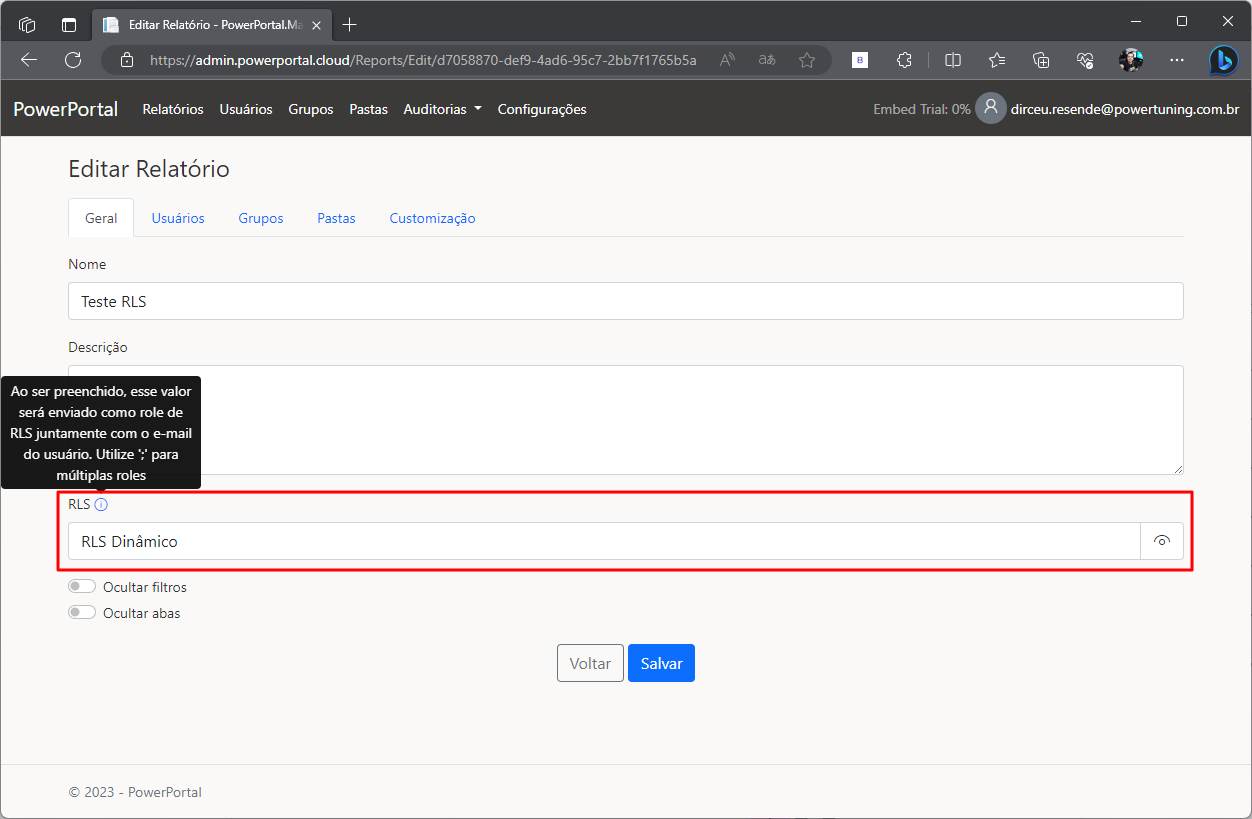
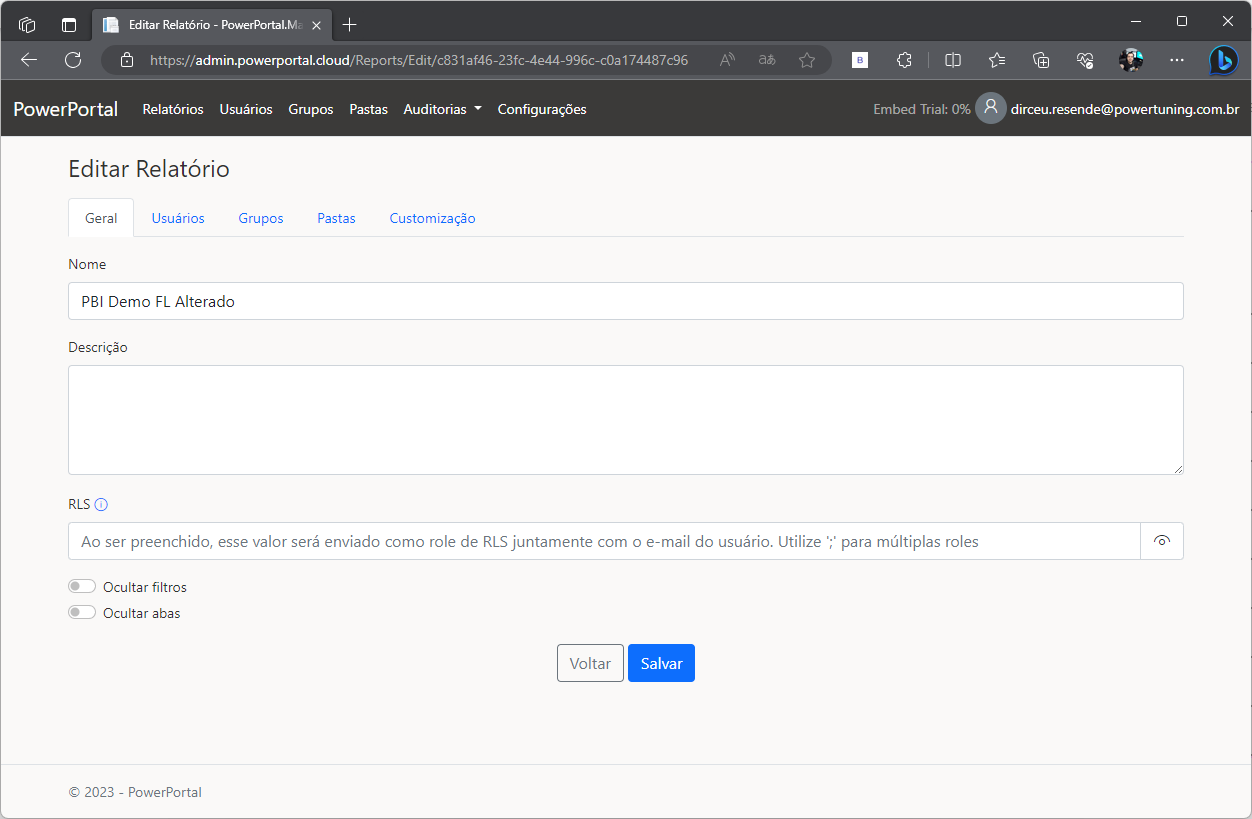 In the “General” tab of editing reports, you can change the name of the report that will be shown in the Visualization Portal, as well as the description of the report, which is shown when hovering the mouse over the Information icon.
It is also on this screen that we can define the RLS rules (See the dedicated topic for RLS).
You can also choose to show or hide the side filter (right side) and the cross-tab navigation buttons (bottom of the screen).
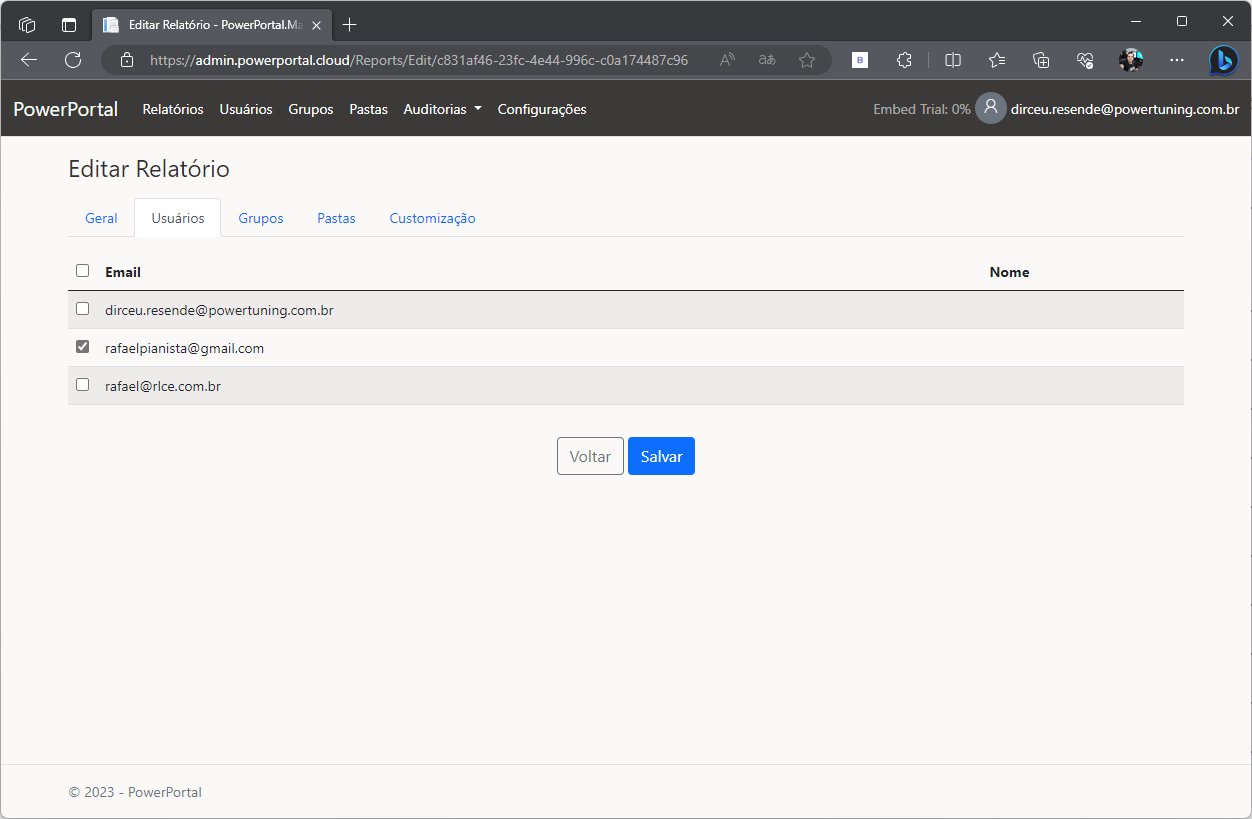 In the “Users” tab, you can view and define who are the users who will have access to the report.
It is worth remembering that user access to the report should be used as an exception and not a rule. Ideally, this access should be granted through access groups, to make maintaining permissions easier.
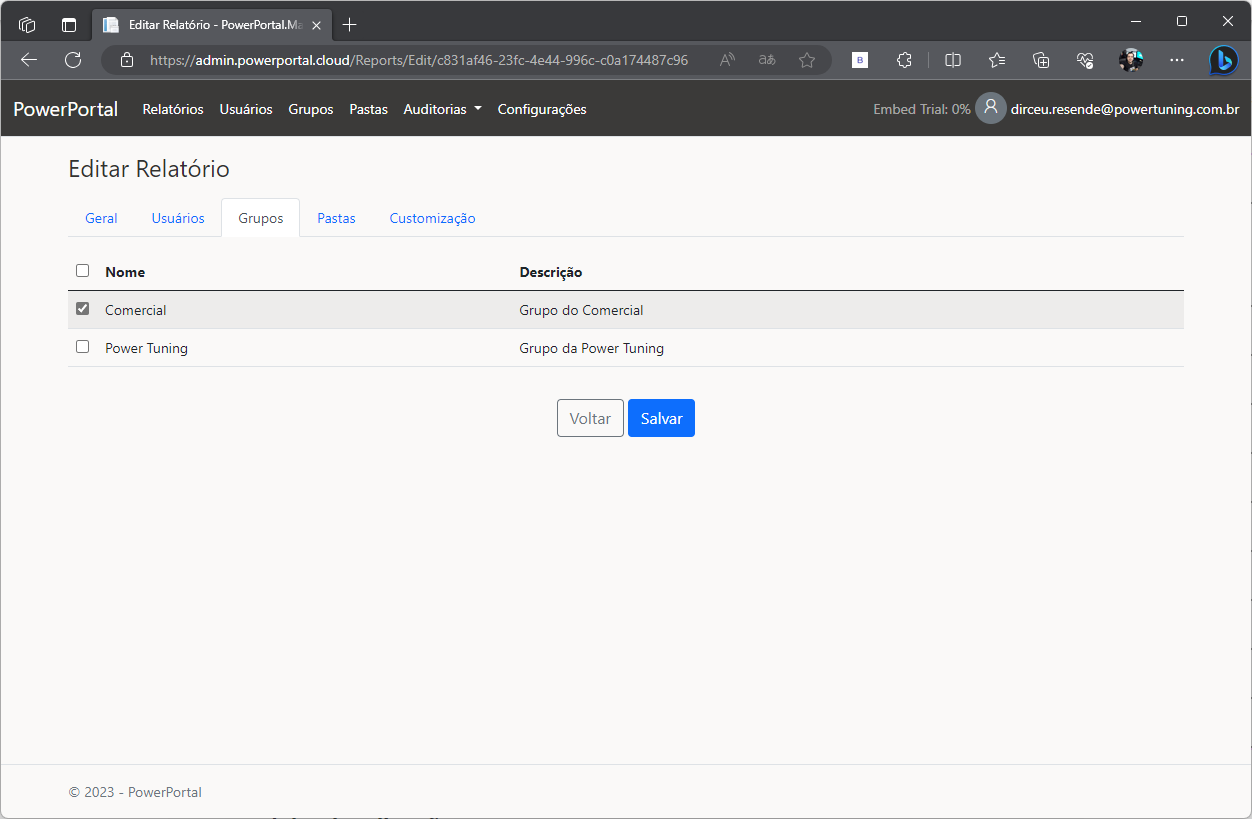 In the “Groups” tab, you can view and define the groups that have access to the report.
This is a good practice of controlling permissions, as it is enough to move the user to the group or remove it from the group, so that the user gains or loses access to the reports.
It is worth remembering that, if the user is removed from the group, but he has direct access to the report, he will continue to access the report.
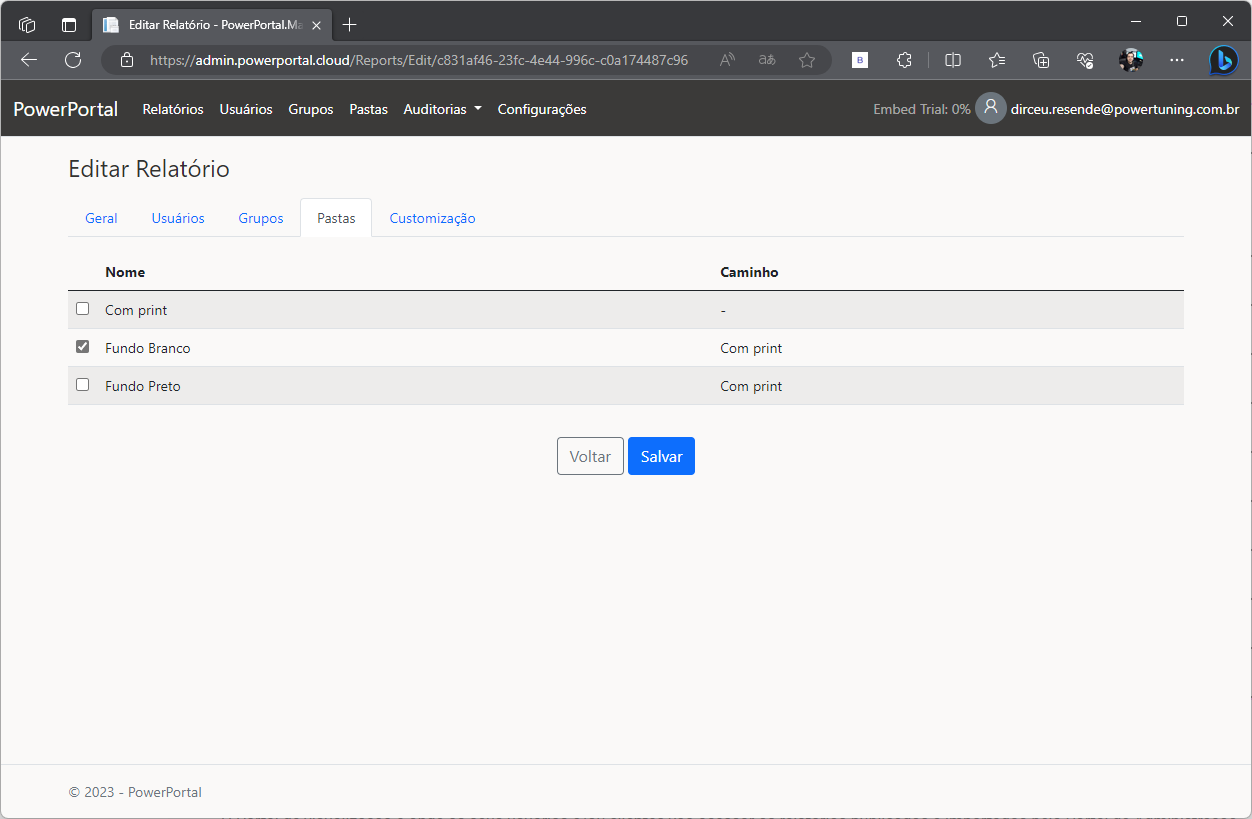 In the “Folder” tab, you can define in which folder the report will be shown.
If you don't click on any folders, the report will be created in the Portal Root at the first level.
If you select a folder, the report will be moved to this chosen folder.
A report can only exist in a single folder, and a folder can have zero or multiple reports.
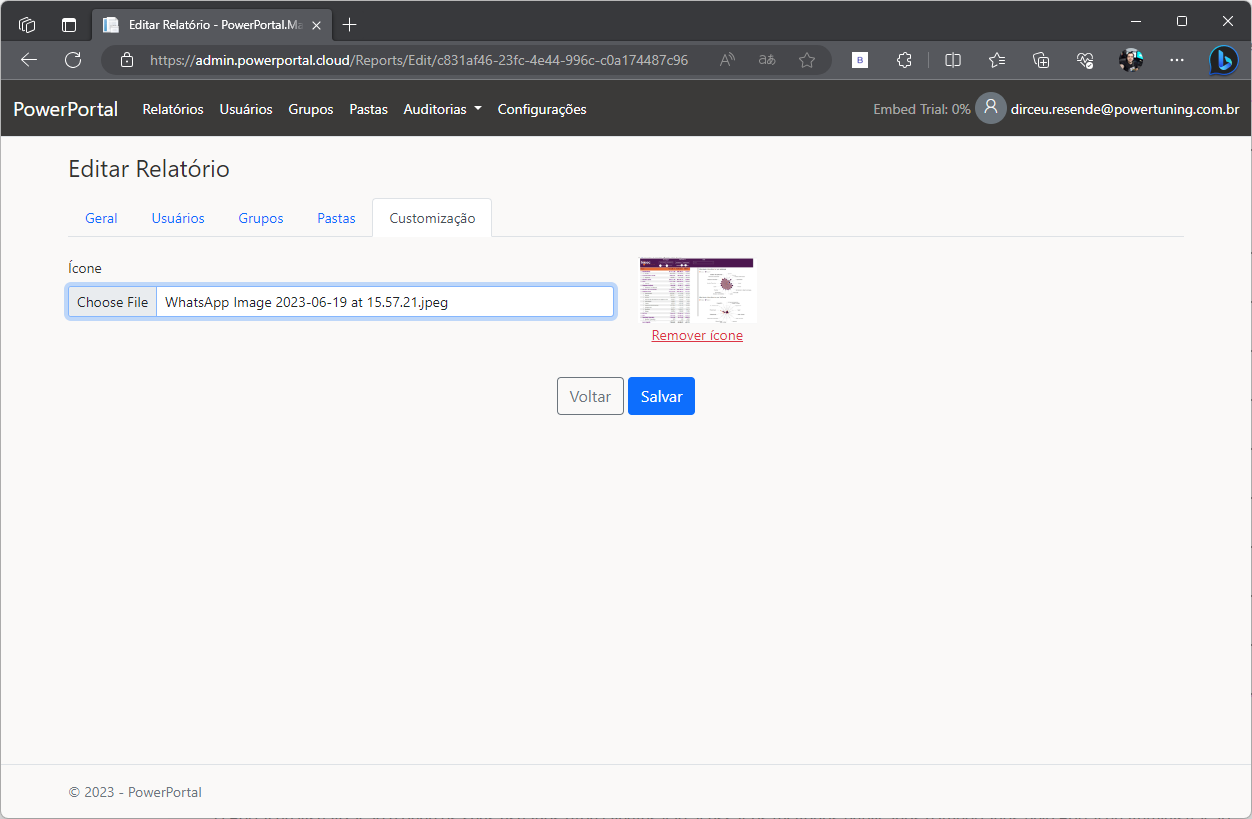 And finally, in the “Customization” tab, you can define an icon or thumb for this report.
This icon will be shown in the “Icons” or “Folders” views in the View Portal.
You can use any images here, but as a recommendation, the result is pretty cool when using a print of the report itself, as it facilitates the preview of the user and gives an idea of which report he is trying to access, even before opening it.
The maximum report icon file size is 2 MB.
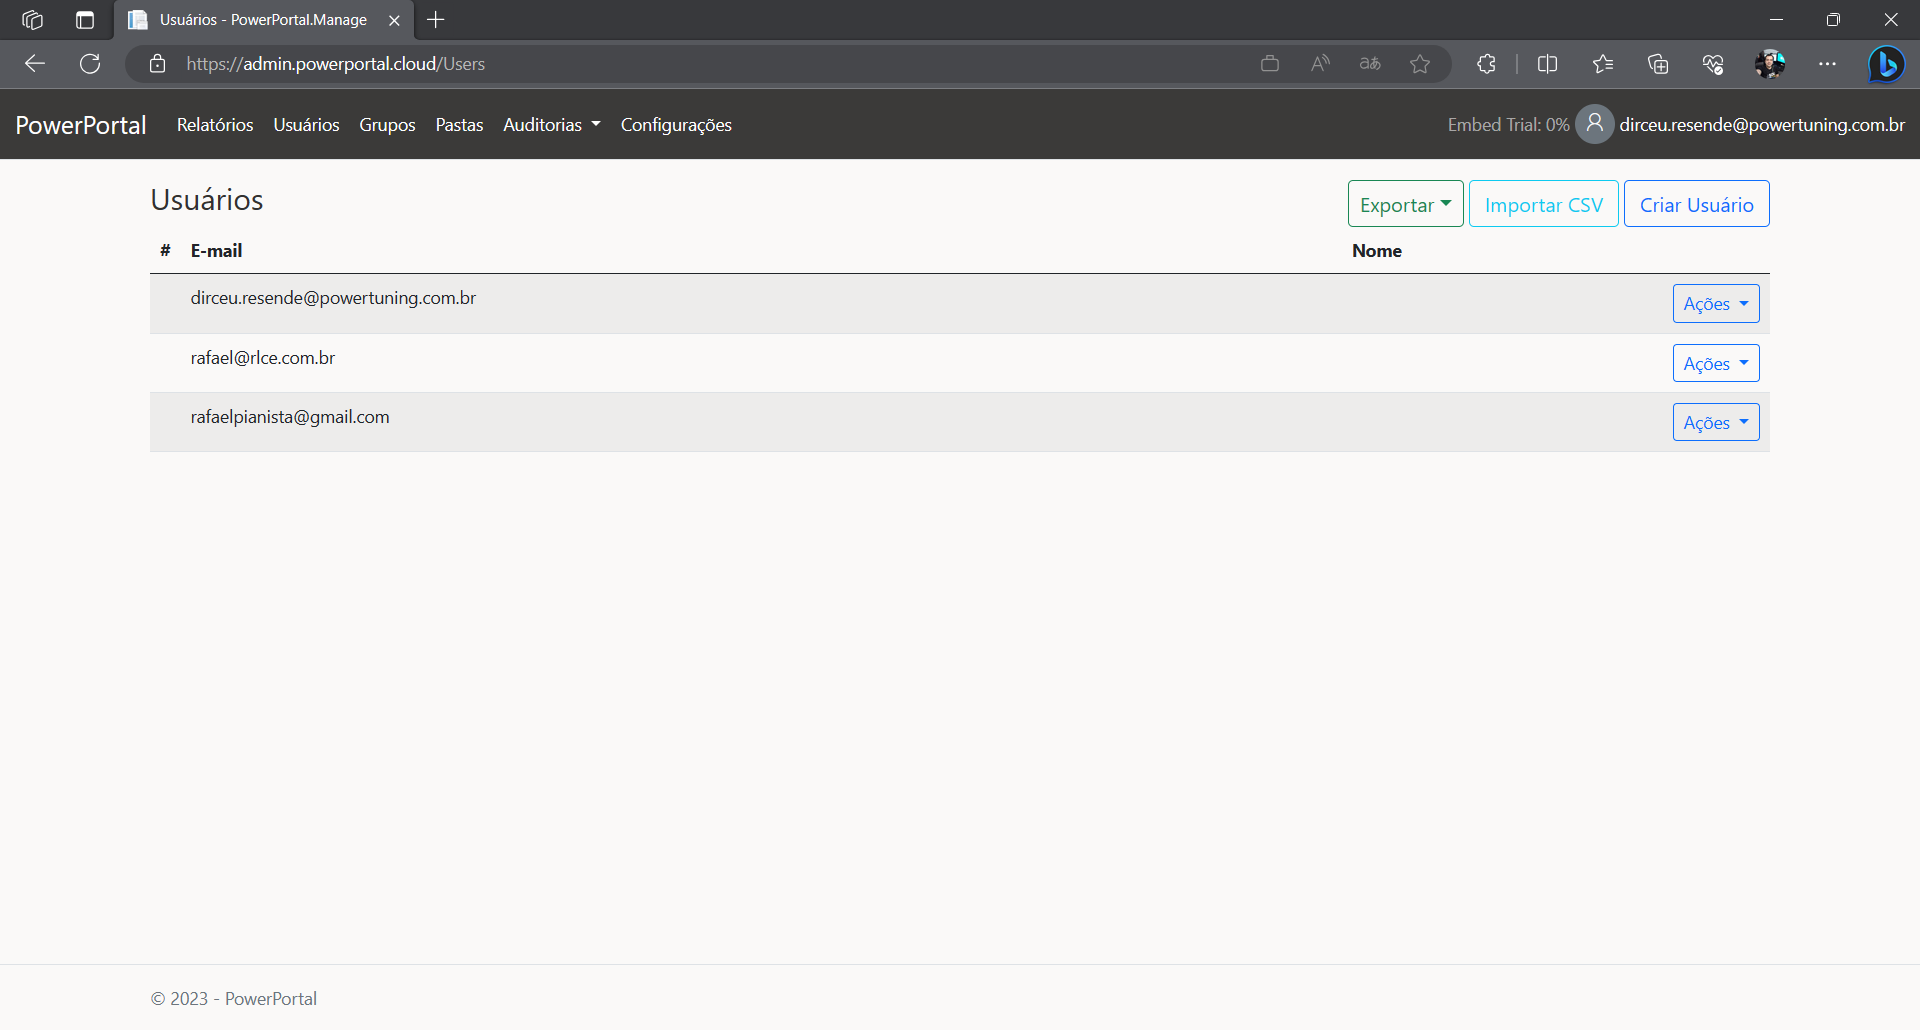
All users are administered through the Administration portal.
Just inform the e-mail and the name of the person so that he has access to the portal.
In the first access, the person will register a password and validate if the e-mail really exists. Unlike Power BI, any email is accepted by the portal, even personal emails like Gmail, Hotmail, etc…
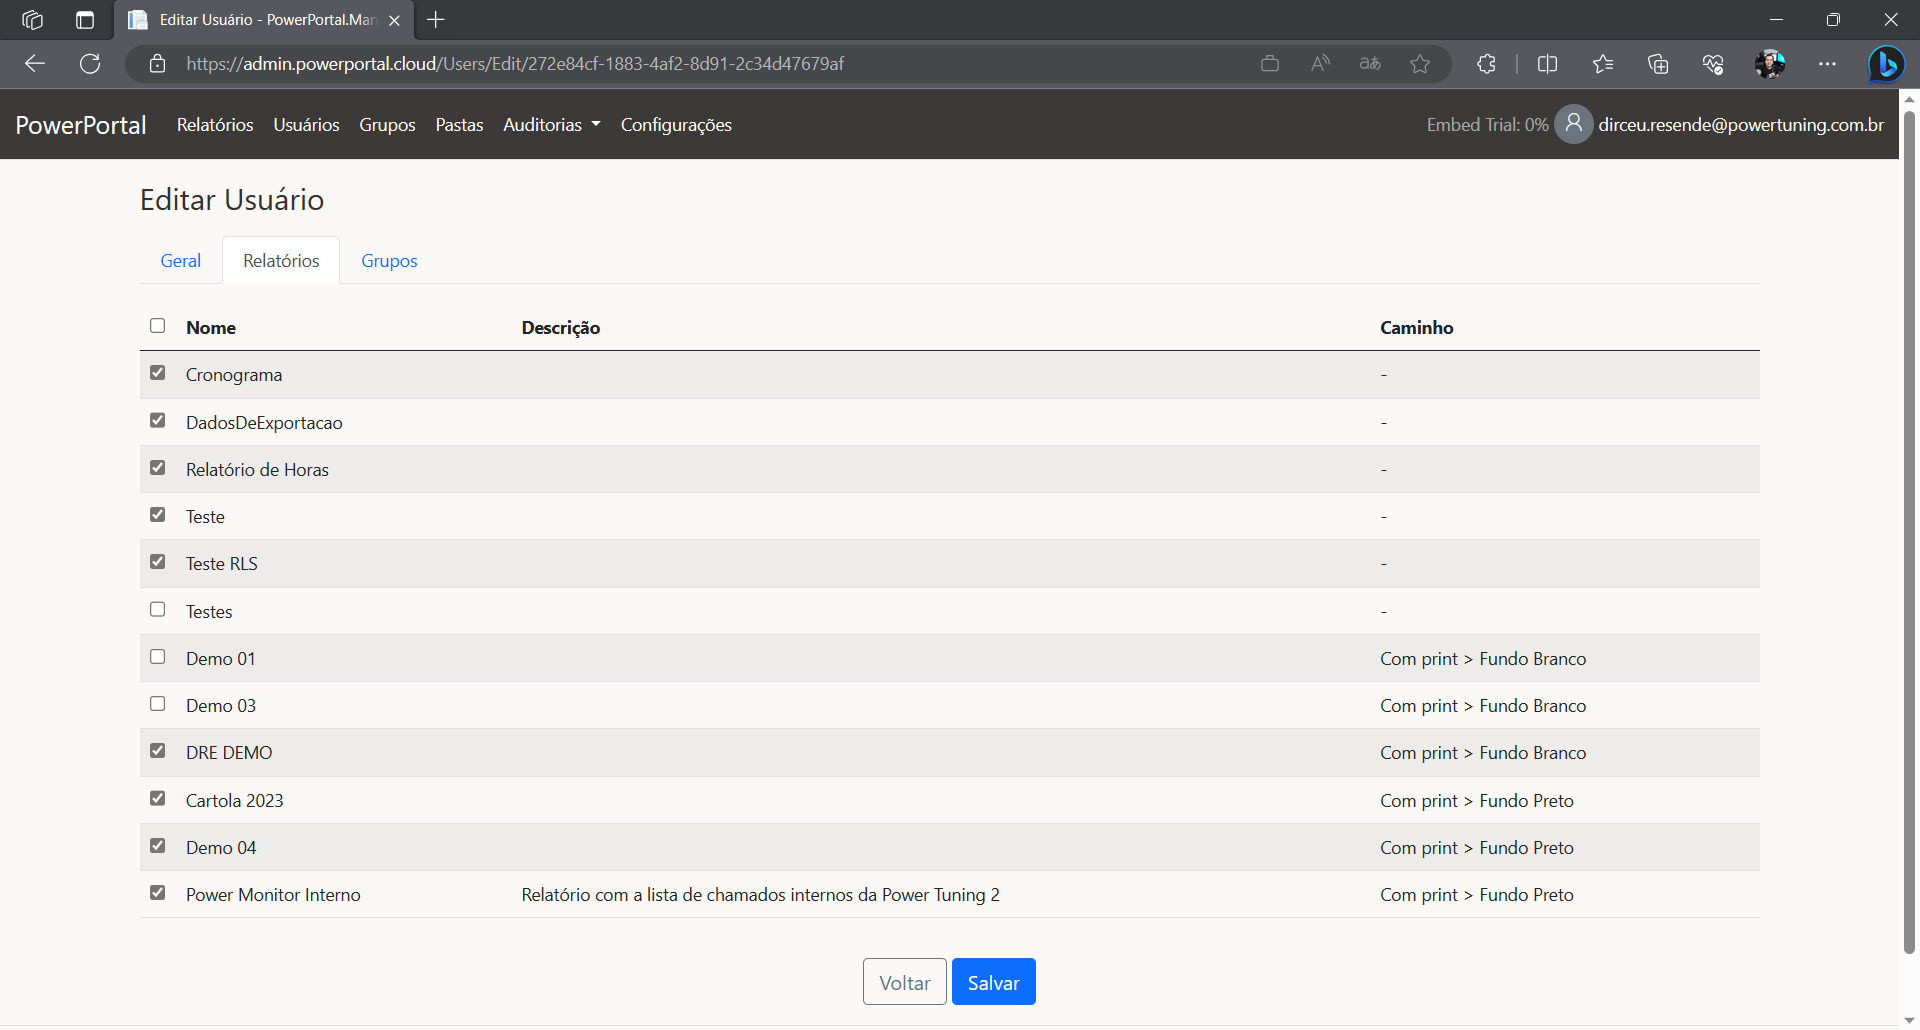 On the user's editing screen, you can view and define which reports this user will have access to directly.
Remember that the reports can also be accessed if the user is in a group that accesses the report.
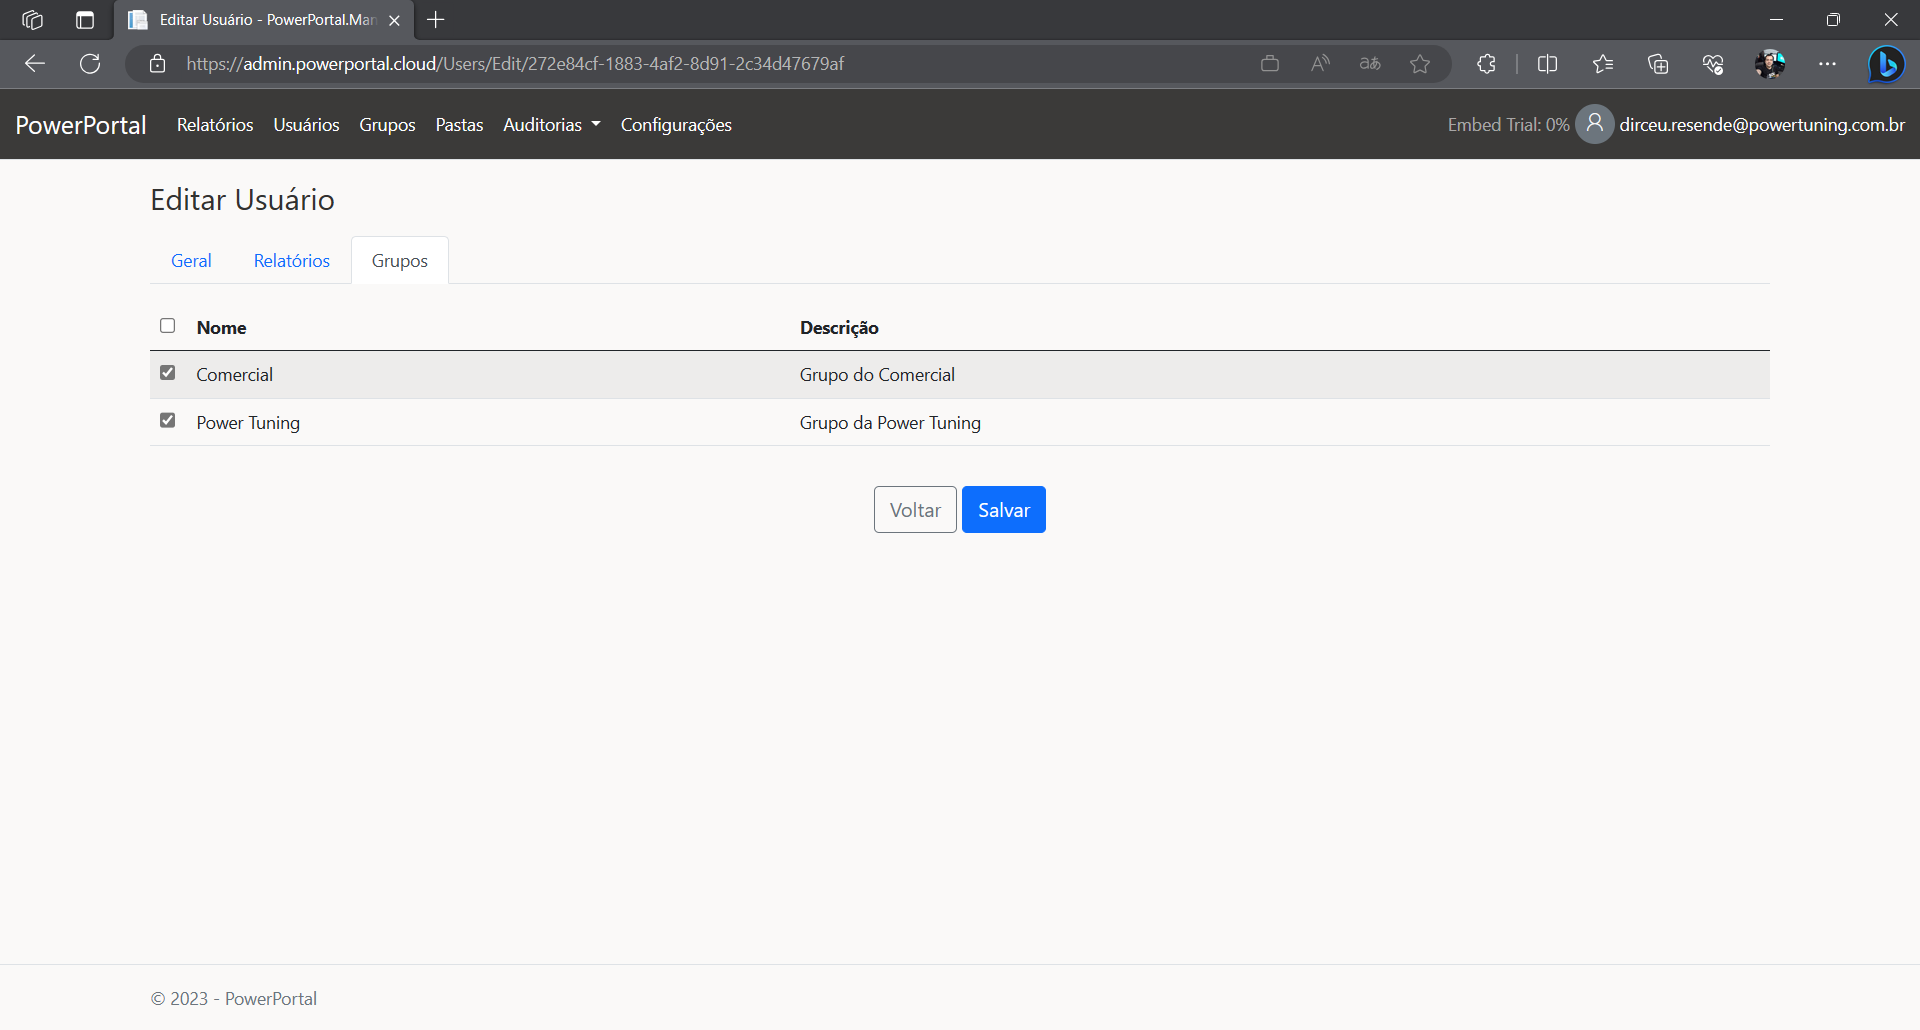 On the user's editing screen, you will also be able to view and define which groups this user is part of.
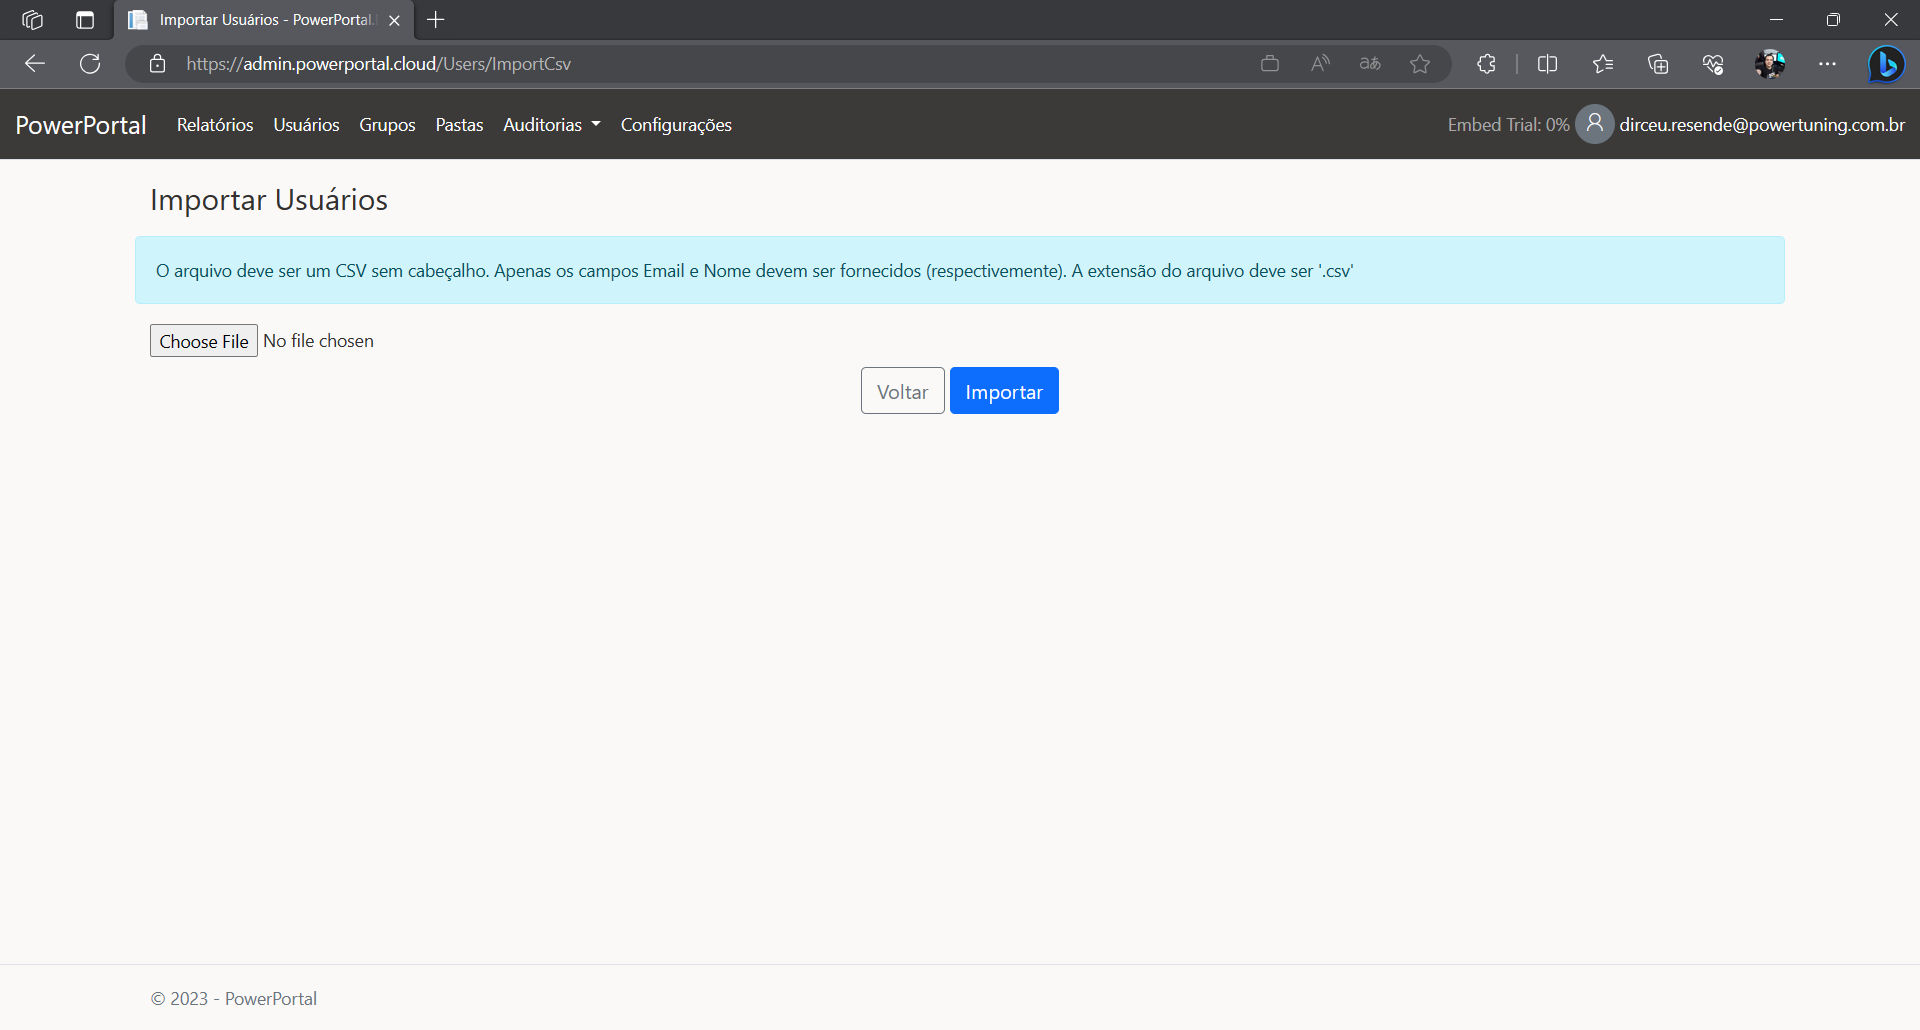 A resource that can facilitate the implementation of the system and bring new customers to the system is the import of CSV files.
This allows you to import a list of users (generated from AD or your system) into the system and then you can just create the groups and edit the groups to define the reports each group can access and the users that are part of each group.
 On the group registration screen, you can view and define which reports this group grants access permission to and which users are part of that group.
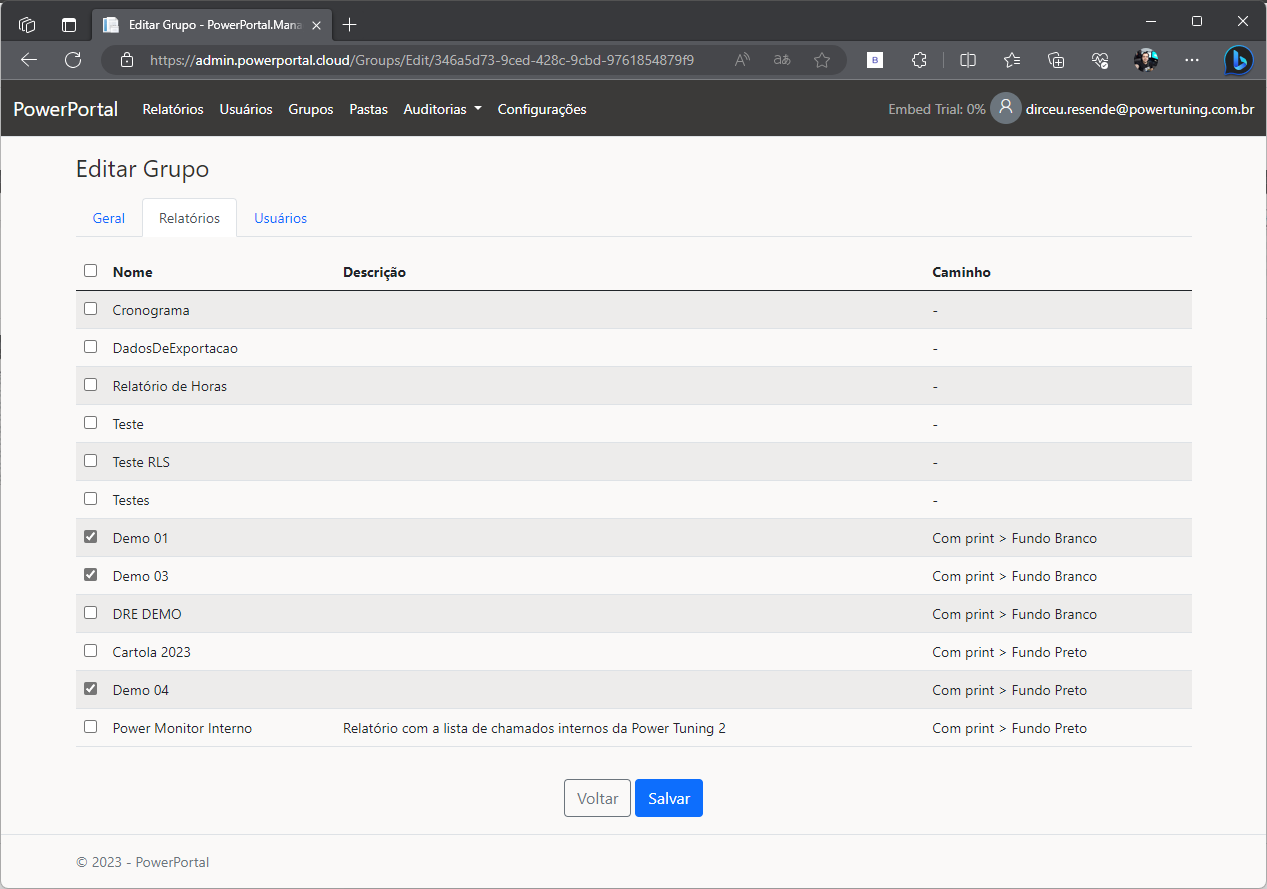
On the group editing screen, we can view and define the reports that this group has access permission.
All reports that the group has access to, users who are part of this group will have access accordingly.
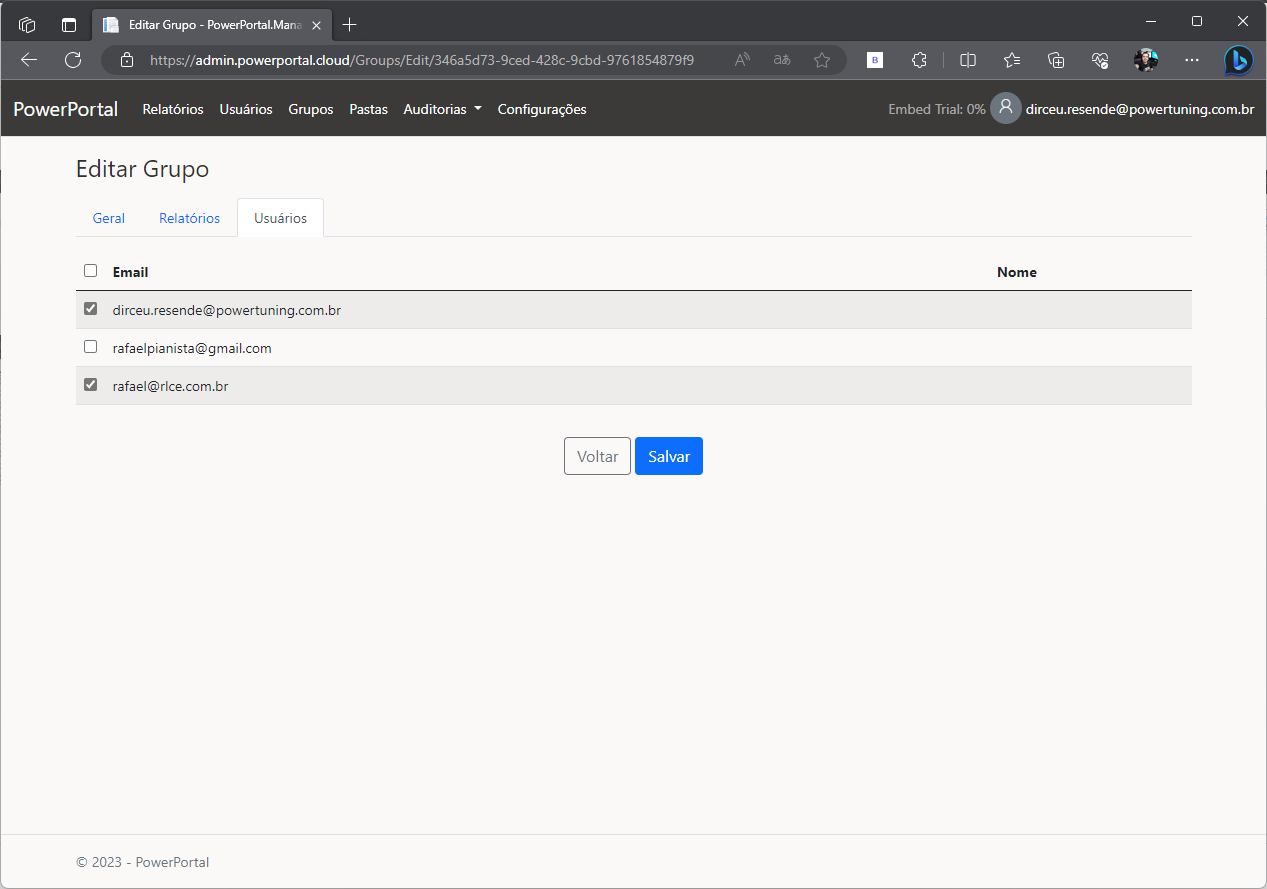
On the group editing screen, you will be able to view and define the users that are part of this group.
Best practice is for users to access reports only via group, save exceptions.
This facilitates access management, where you just need to move the user to another group and all permissions will be automatically updated.
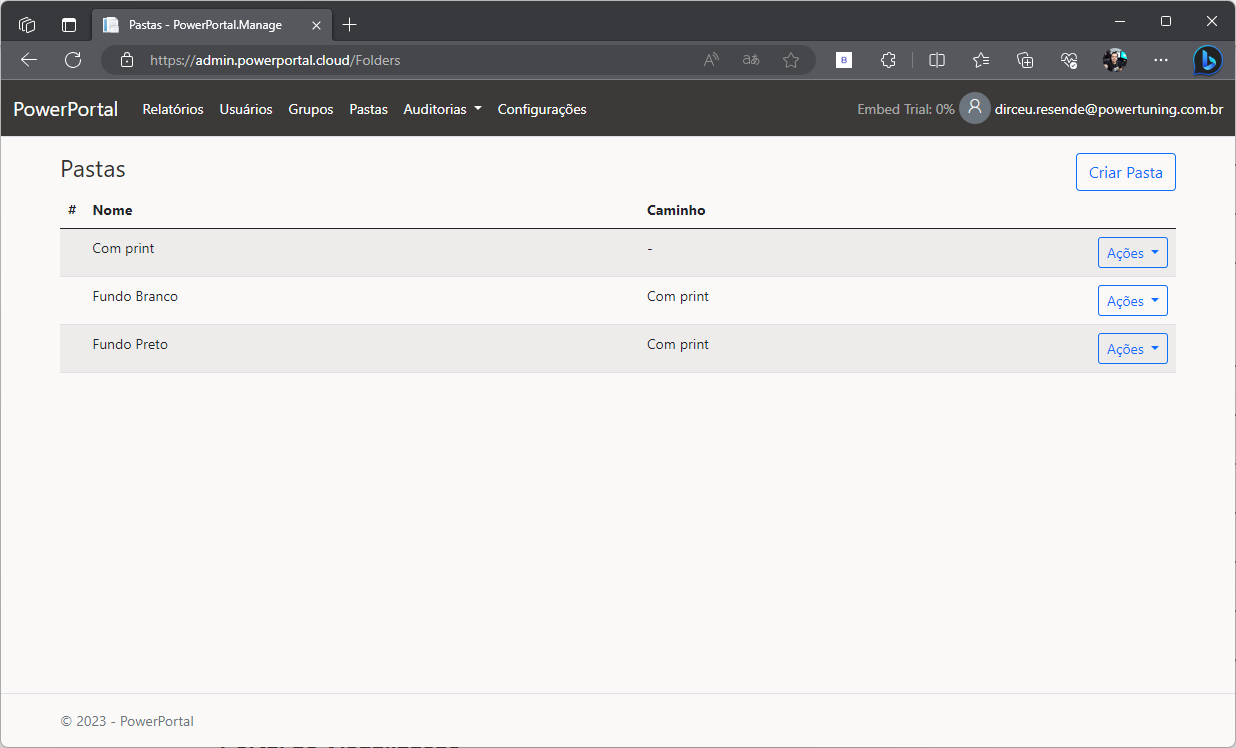 Folder mastering lets you logically group reports into folders, similar in concept to Power BI workspaces.
Different from the workspace, where there is only 1 hierarchy level (Workspace > Report), in Power Embedded, there are no limits for hiarchy levels: You can create N levels deep, according to your needs. This allows you to create a structure like this: Commercial > Southeast > São Paulo > Sales.pbi
Folders do not have permissions. If the user has access to one of the reports in the folder, he will see that folder. If he does not have access to any report in this folder, he will not see it.
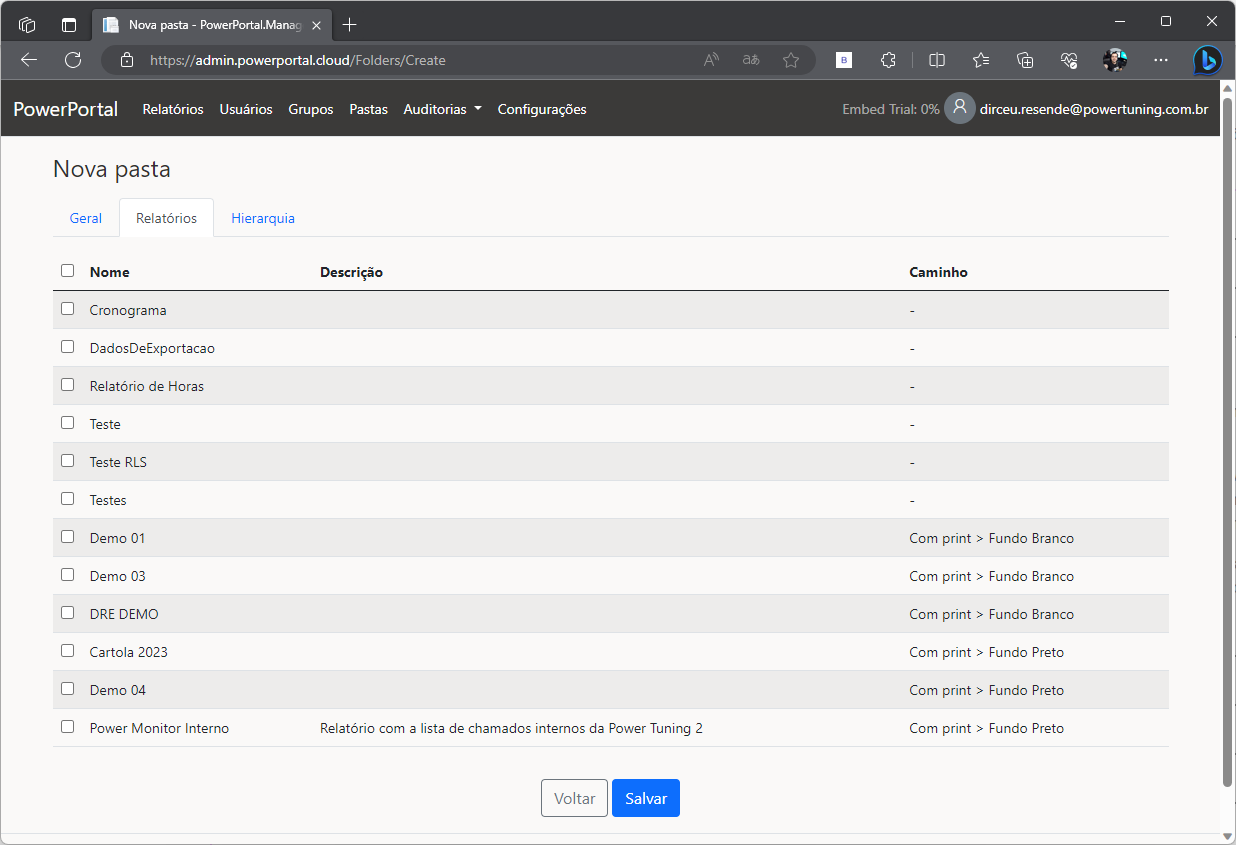 In the folder editing screen, you will be able to view and define which reports this folder contains.
The reports that are in this folder will be marked in this listing.
When you bookmark a report from the list that is in another folder, it will be moved to that folder. A report can only exist in one folder.
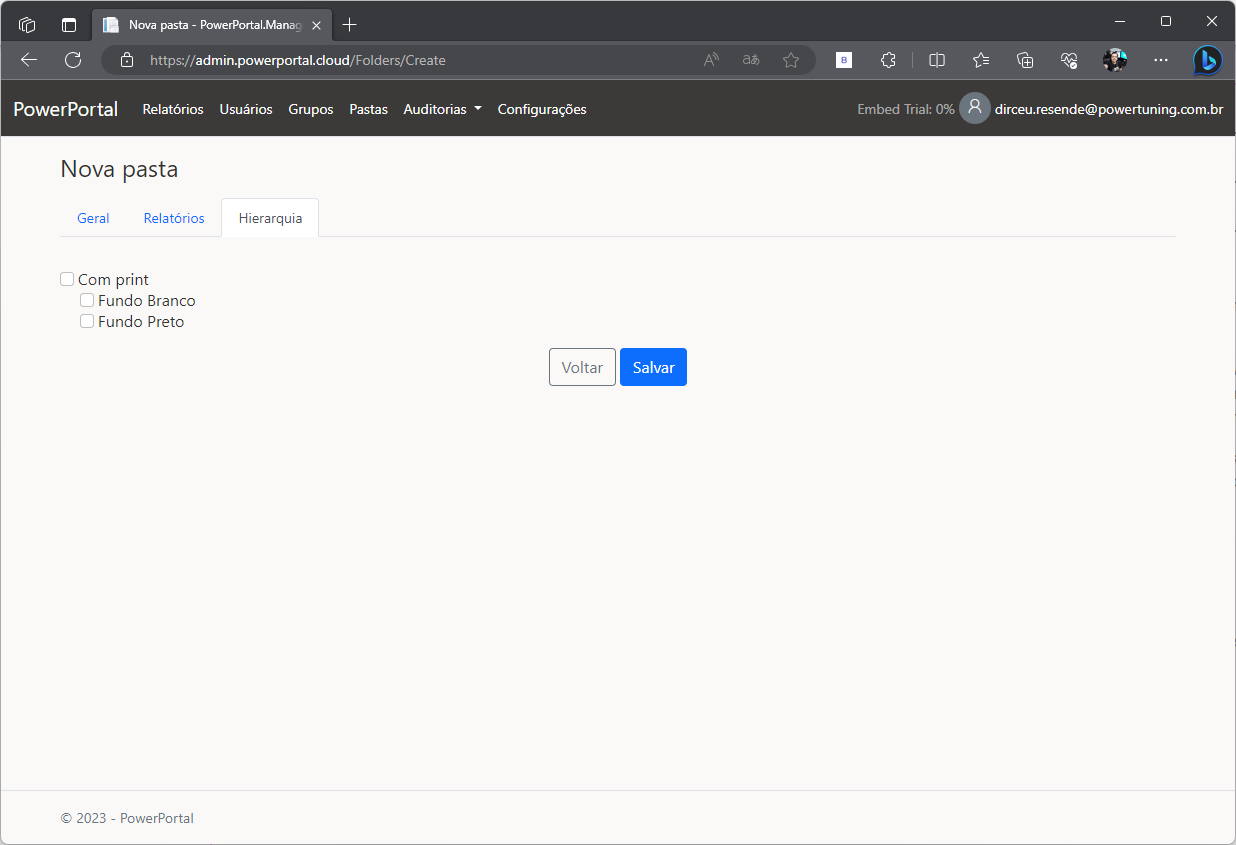 In the Hierarchy tab is where you will define if the folder will be in the Root of the portal or will be a “child” of another folder.
If you do not select any folder on this tab, the folder will be in the Root of the portal.
If you select a folder on this tab, the folder in question will be a child of this one.
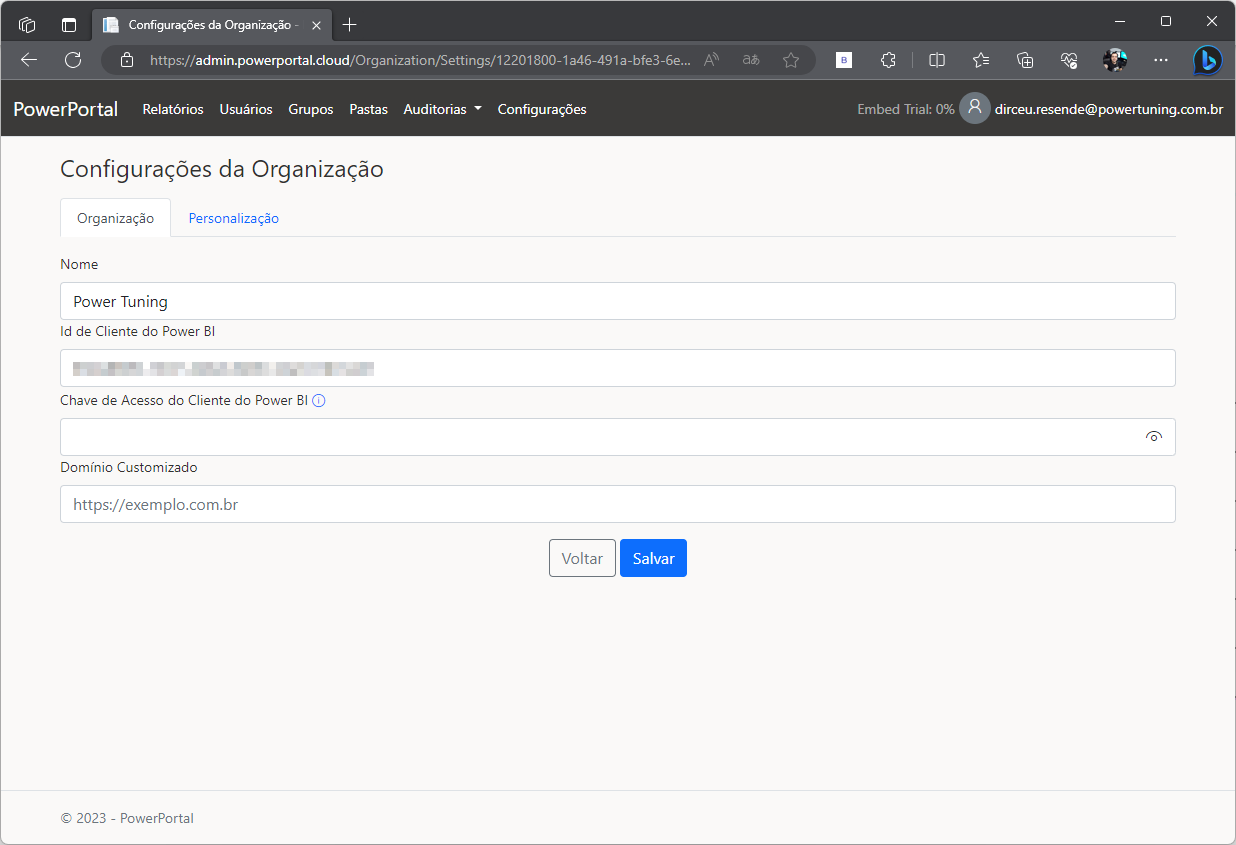 On this screen is where you can configure your company name, object IDs to configure integration with Azure AD and Tenant.
It is also on this screen that you will configure the custom domain, in case you want to access the visualization portal using your domain and allow your users or customers to access the portal using a URL such as: bi.suaempresa.com.br
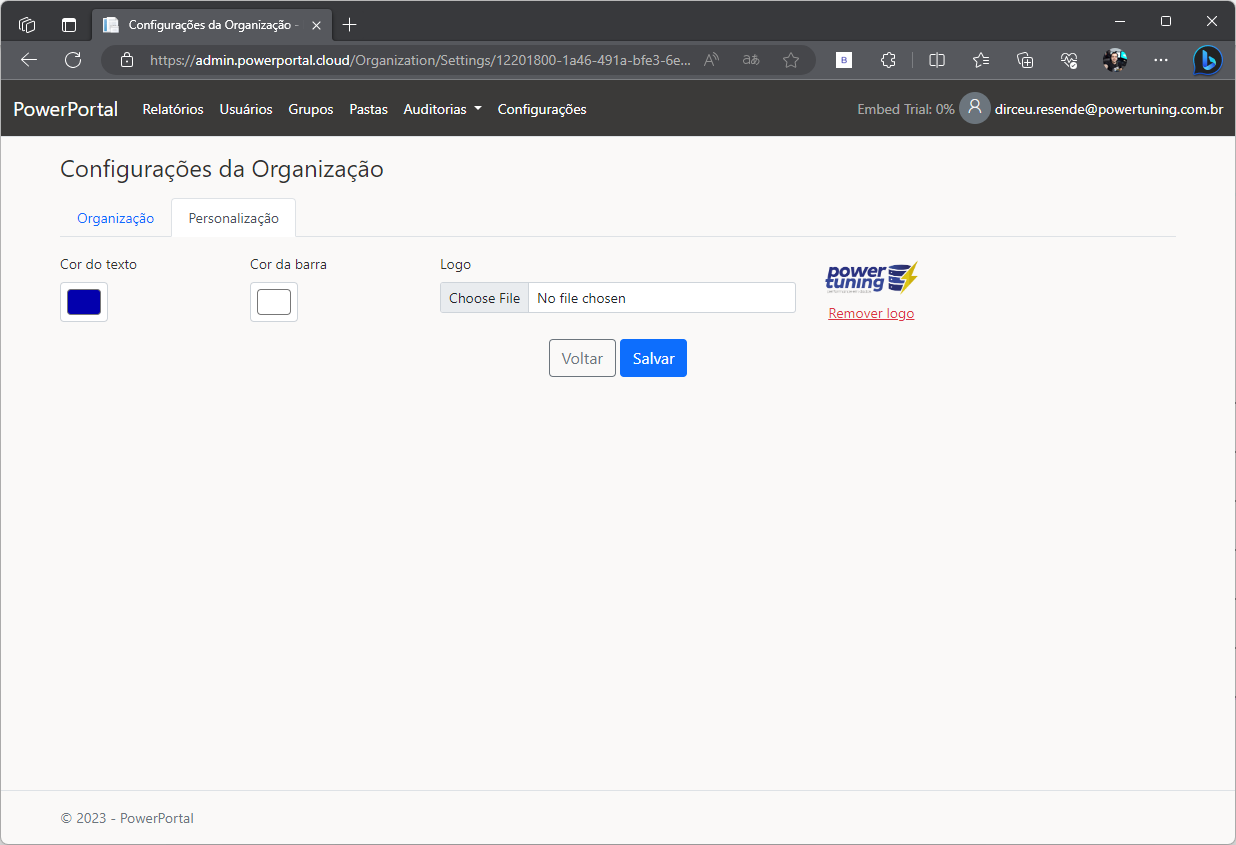 In the “Customization” tab is where you will define the background and text color of the menu bar, and also the logo that will be shown in the visualization portal menu.
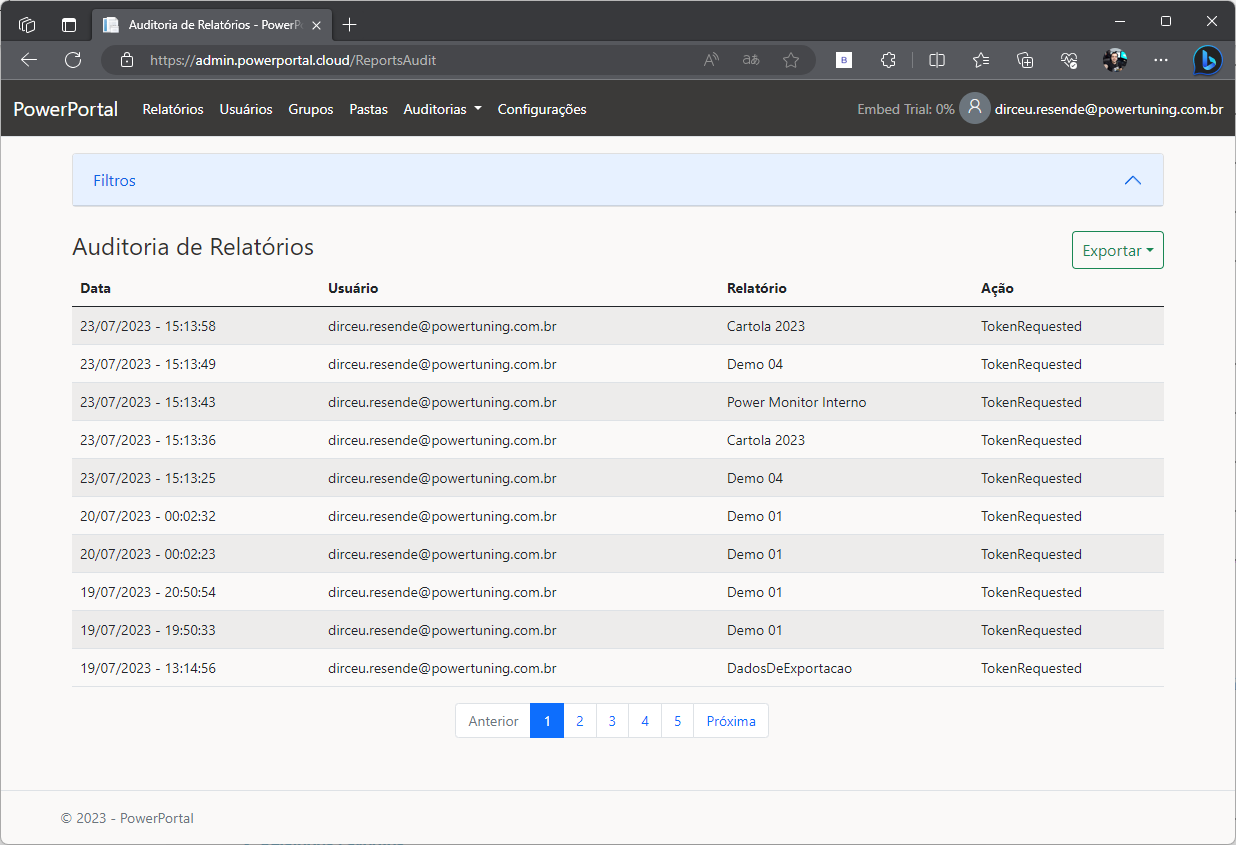 Each time a report is accessed from the preview portal, an audit event is generated.
In the “Audit of Reports” of the administration portal, it is possible to visualize each of these accesses and understand how users are accessing the reports.
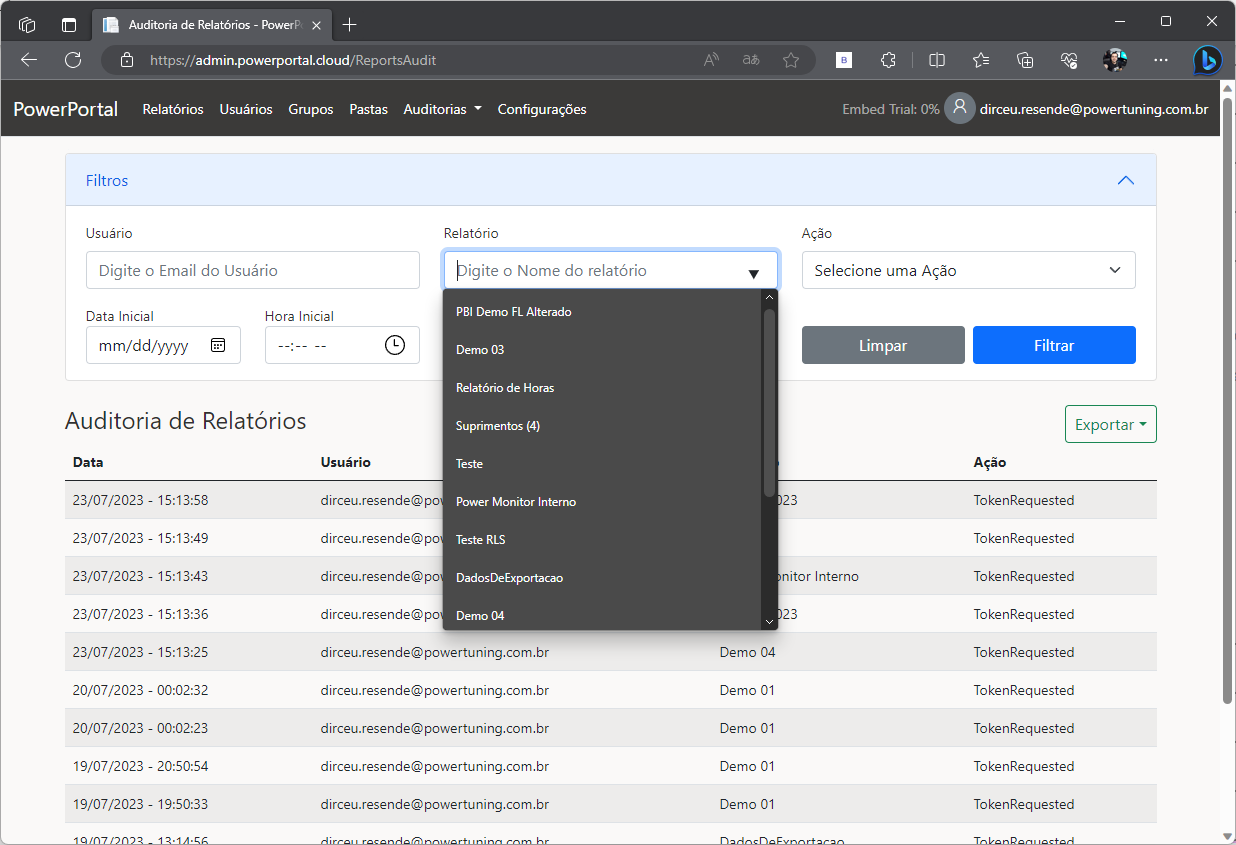 It is also possible to filter the audit logs by a specific period, by the user who viewed it (autocomplete) and/or by the name of the report (autocomplete).
This allows you to view:
– All views in a given period
– All reports that a given user viewed
– All users who viewed a particular report
 Every action performed in the administration portal generates an audit event.
This makes it possible to audit data inclusions, changes and deletions made through the administration portal, giving greater control and traceability of information.
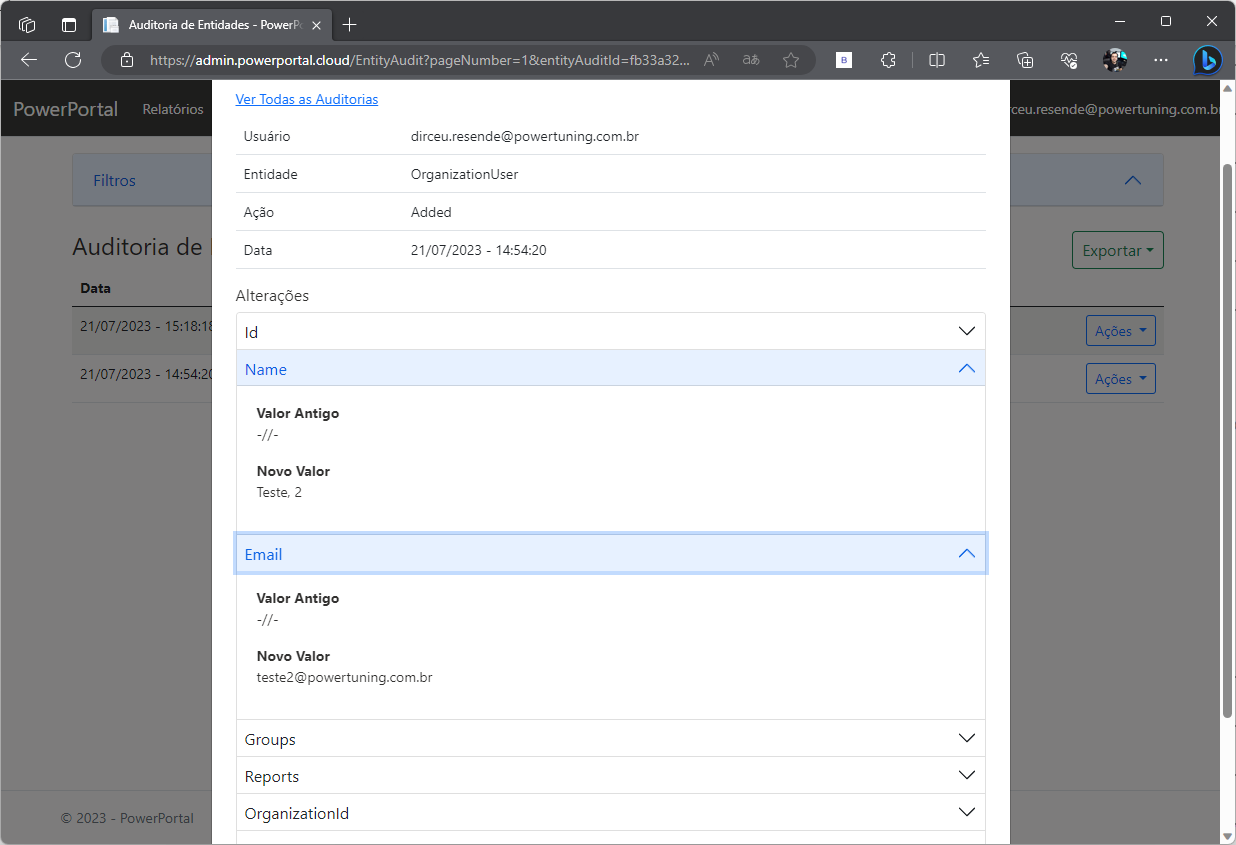 By clicking on the “Actions” > “View Details” button, you will be able to view more information about the audit record in question, such as the data added/changed/deleted.
This allows identifying the changed information, viewing the previous value and the new value defined by this change.
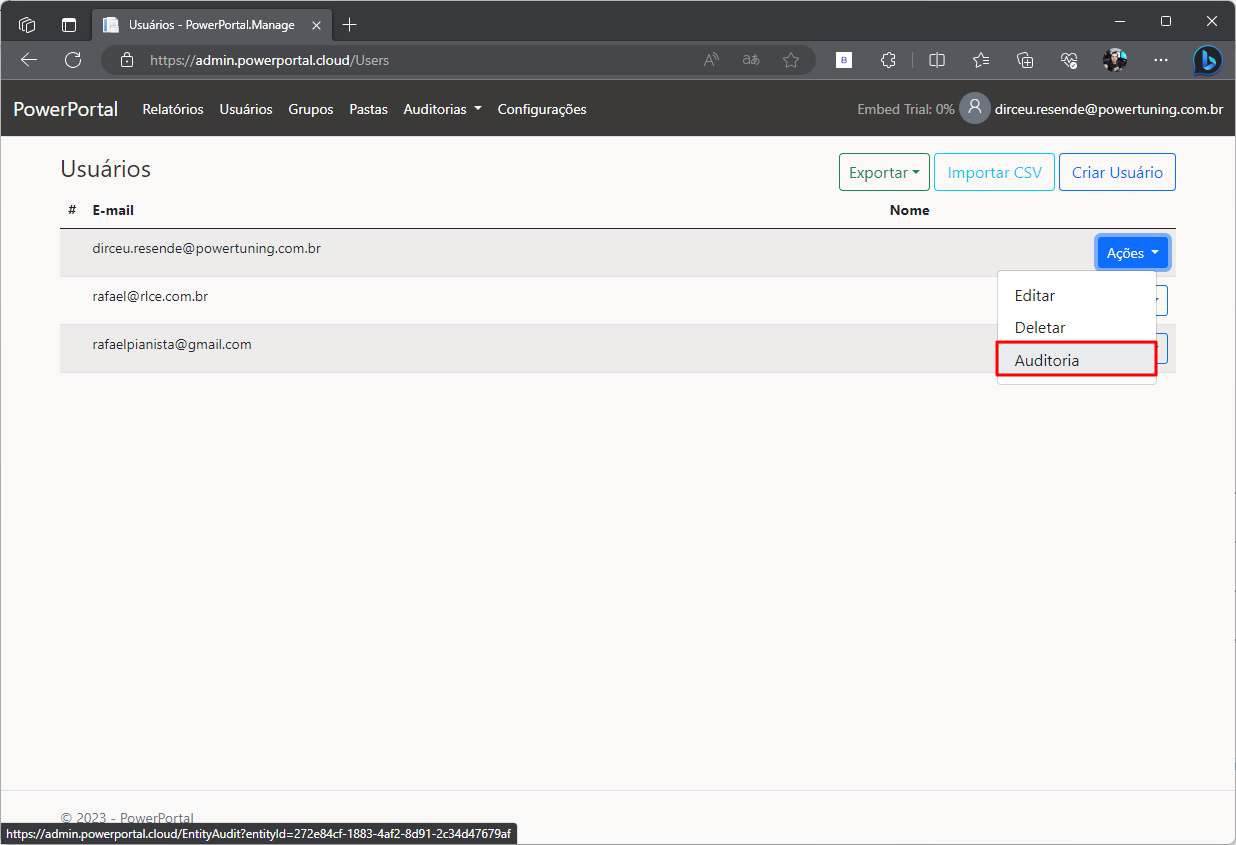 In all registration screens of the administration portal, there is an “Audit” button in the menu.
This allows you to quickly view all changes involving the selected record in question.
Example: If I click on the “Audit” button in a user's registration, I will be able to view the entire history of changes that this user has undergone, since the initial registration, going through all the changes.
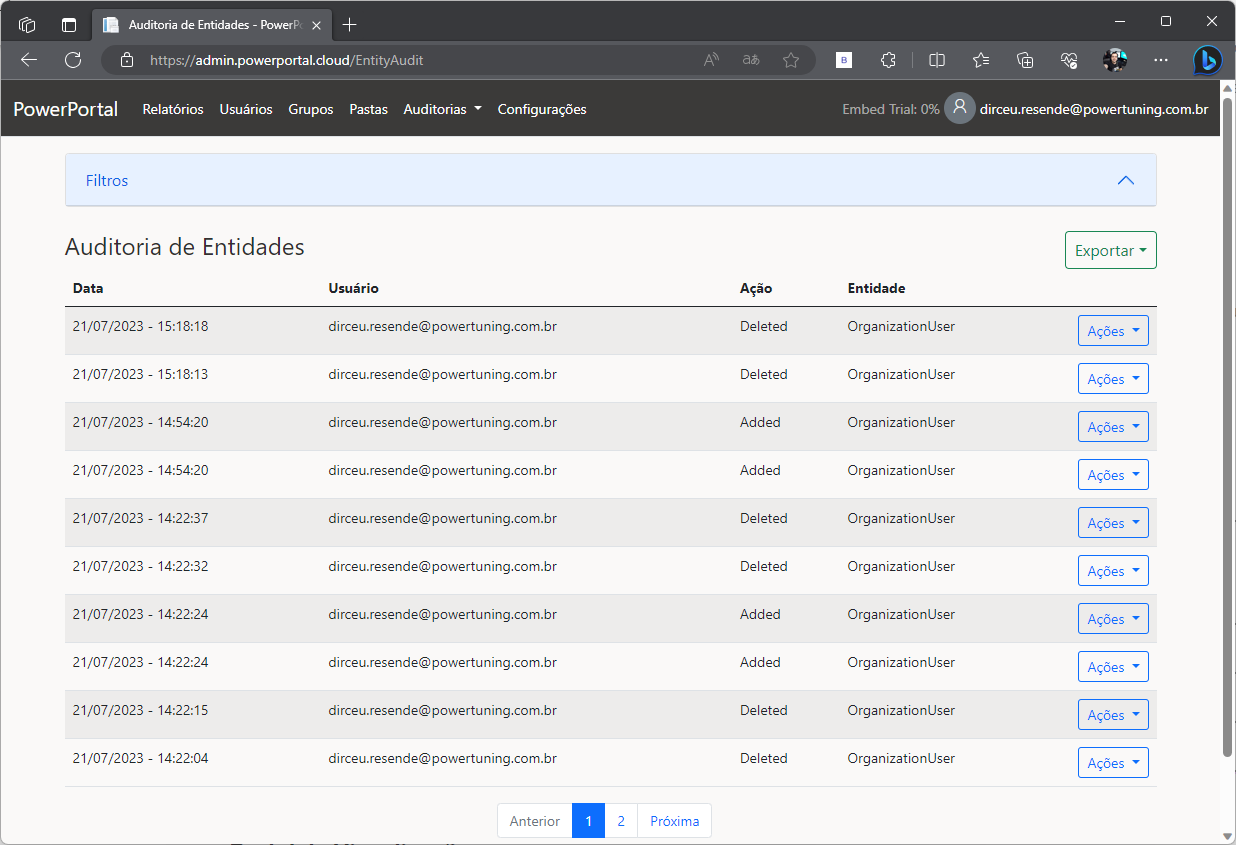
In case of deletion, the record can be located on the “Entities Audit” screen.
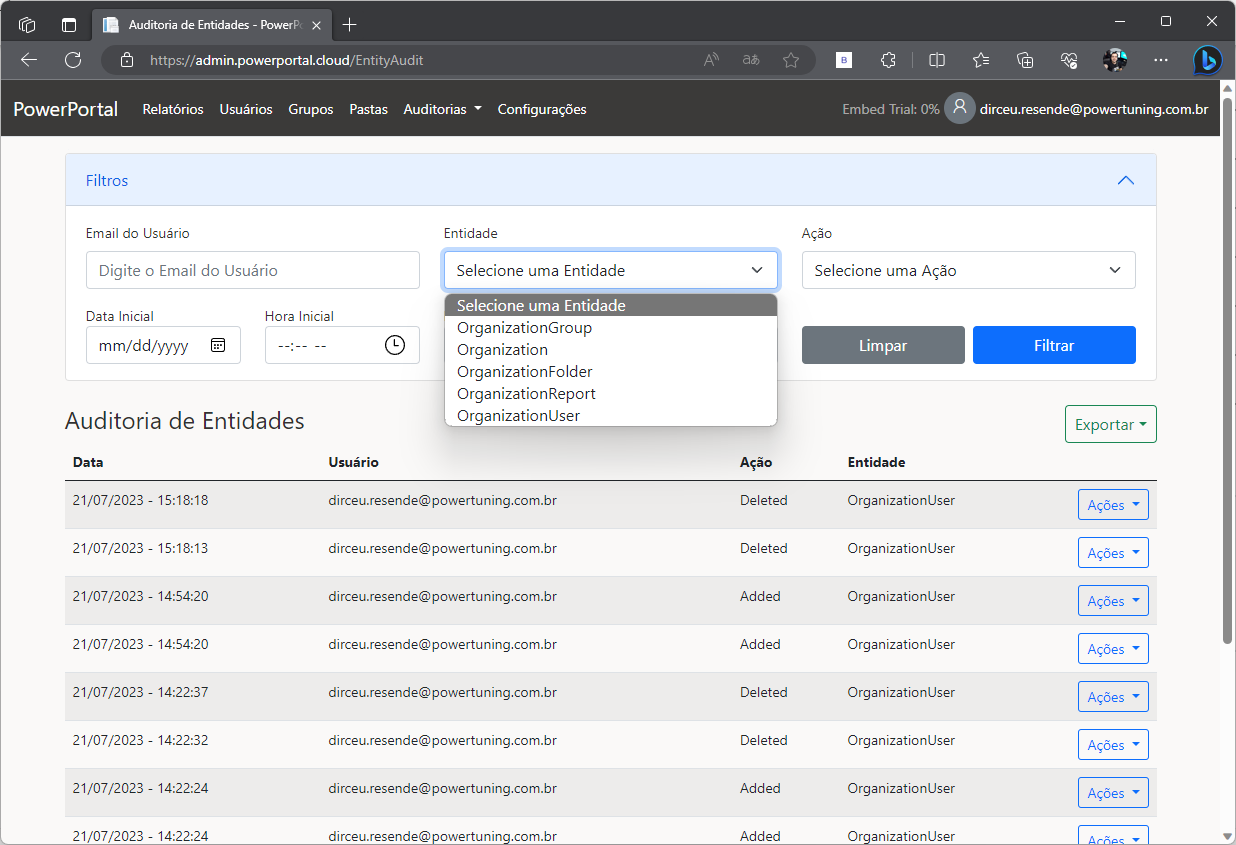 It is also possible to filter the “Entity Audit” records by the user who made the changes, the type of entity change, the action and a specific period.
This allows you to view:
– What has changed in a specific period
– All actions performed by a given user
– All actions of a certain entity type (Ex: OrganizationReport or OrganizationUser)
– All actions of a certain type (Ex: Added, Updated or Deleted)
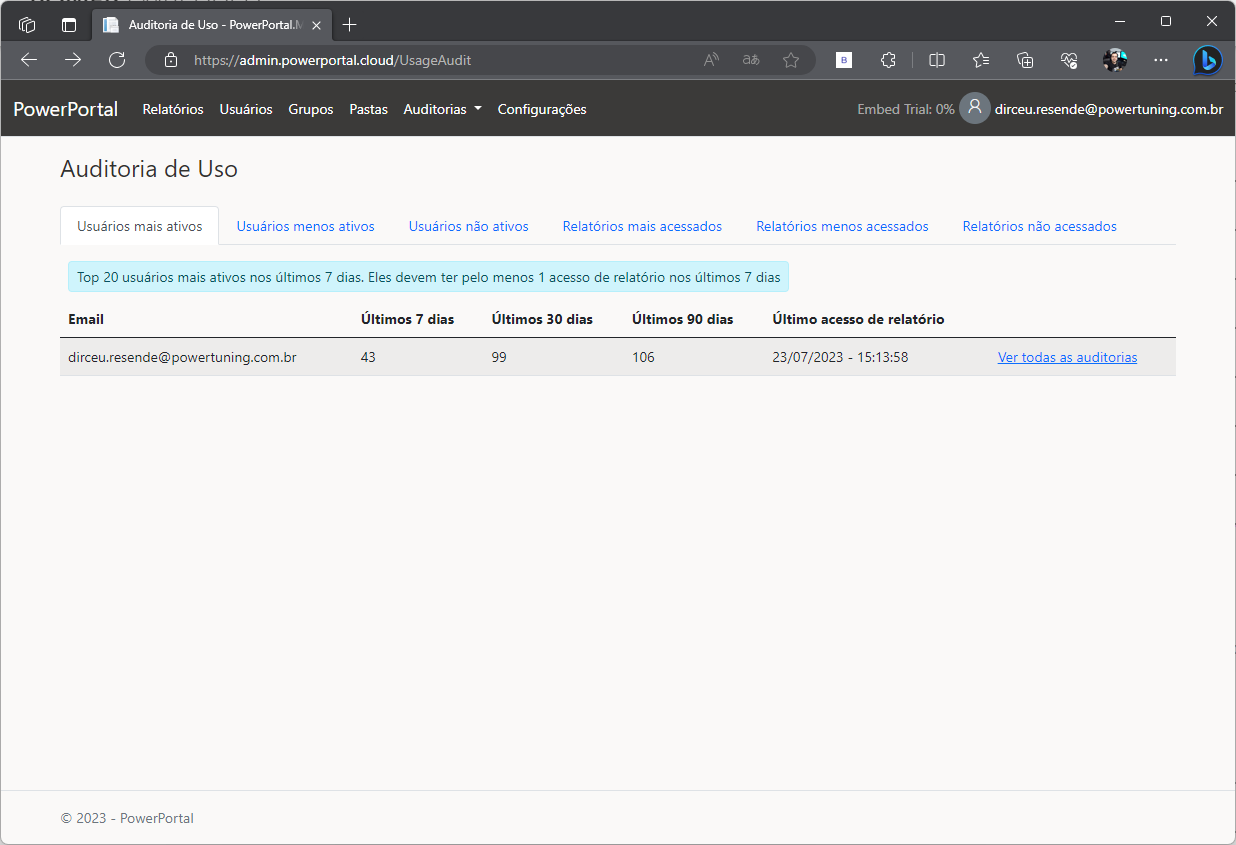 On this screen, you can view the users who are using the portal the most, who are using it the least and who are not using it within the 90-day period.
As Power Embedded pays for the number of registered users, this is very useful to identify users who are generating a cost for the company and are not using the tool.
Information is generated for all portal users and reports, regardless of which workspace or folder they are in.
By clicking on the link “See all audits”, you will be able to view each access event of the chosen report and see all the accesses of reports made by that user
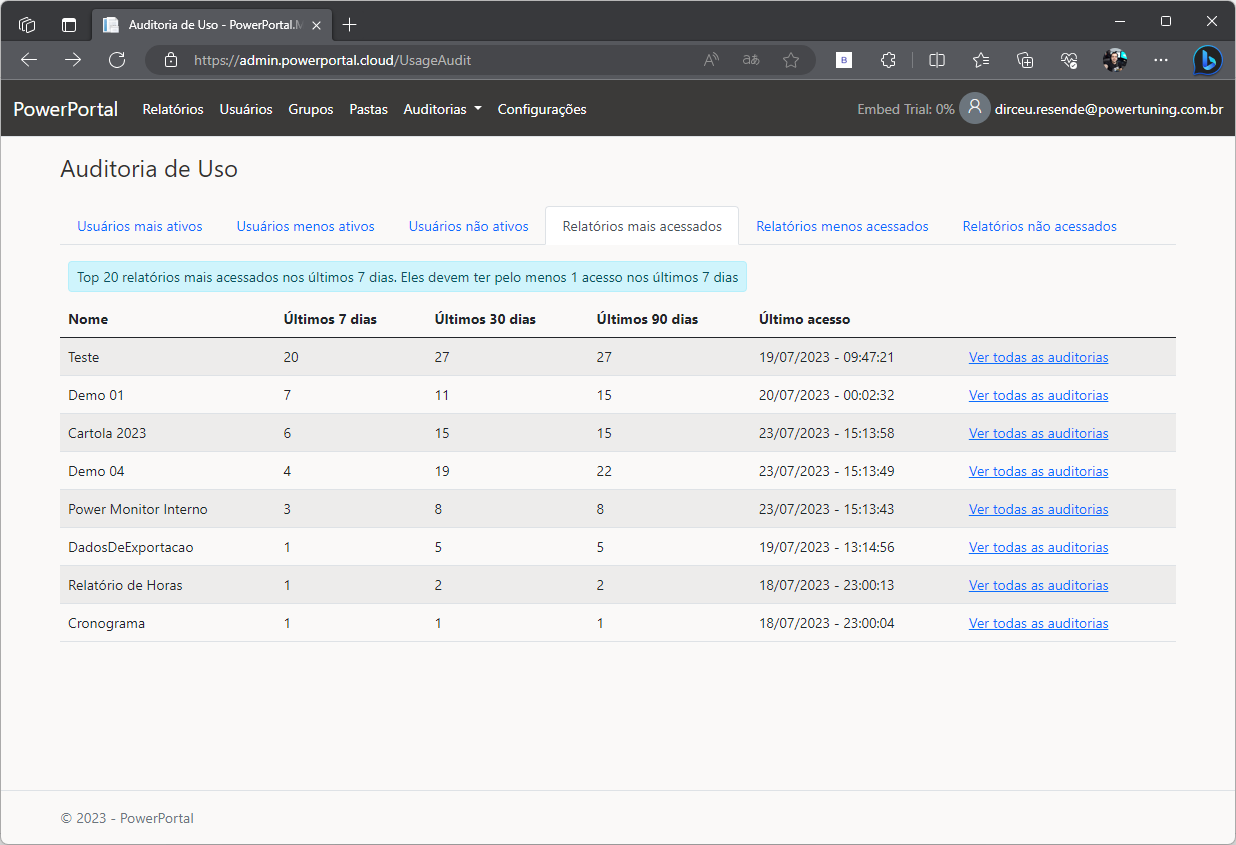 In the same view of users, you can also identify reports most accessed, least accessed and not being accessed in the last 90 days.
This is to identify reports that are consuming processing resources and maintenance/monitoring time, but are not being used by anyone.
By clicking on the “See all audits” link, you will be able to view each access event of the chosen report and see who accessed and when the report was accessed.
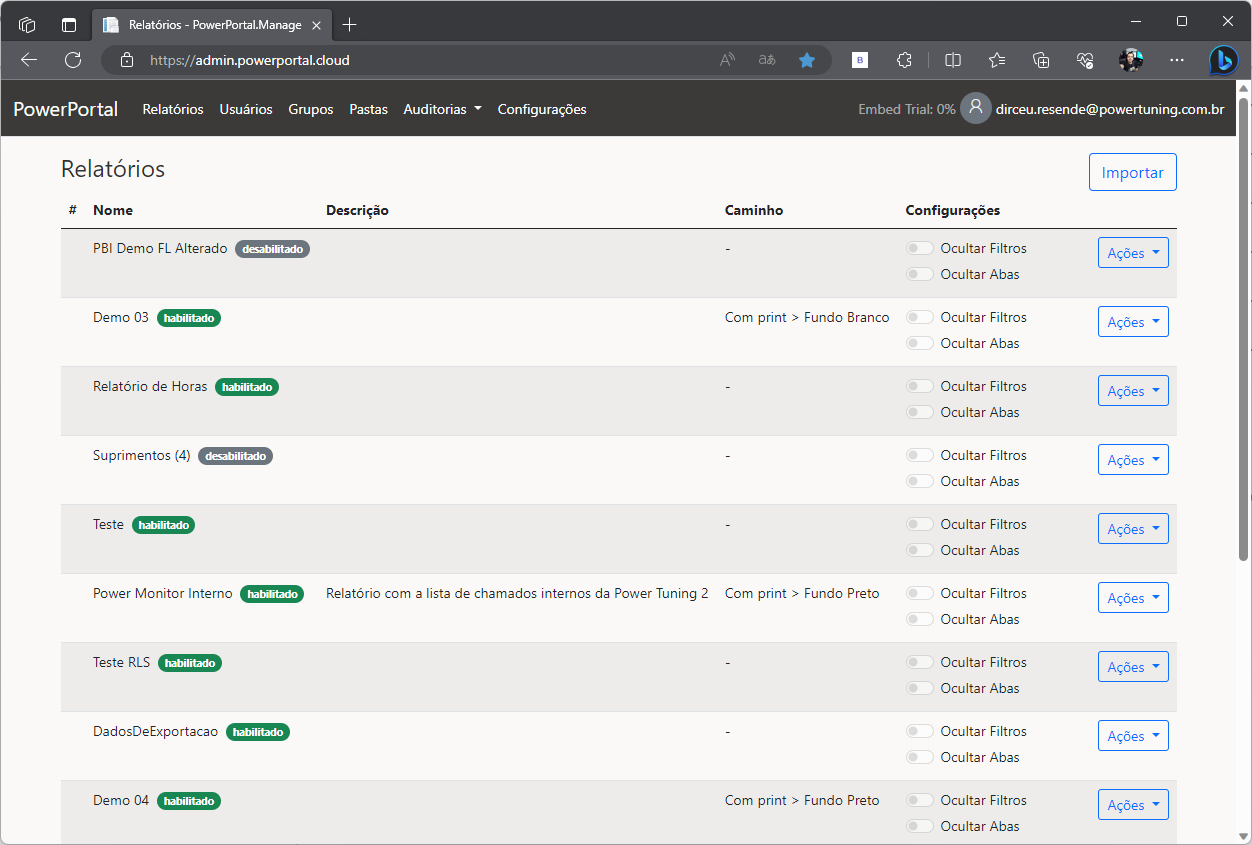
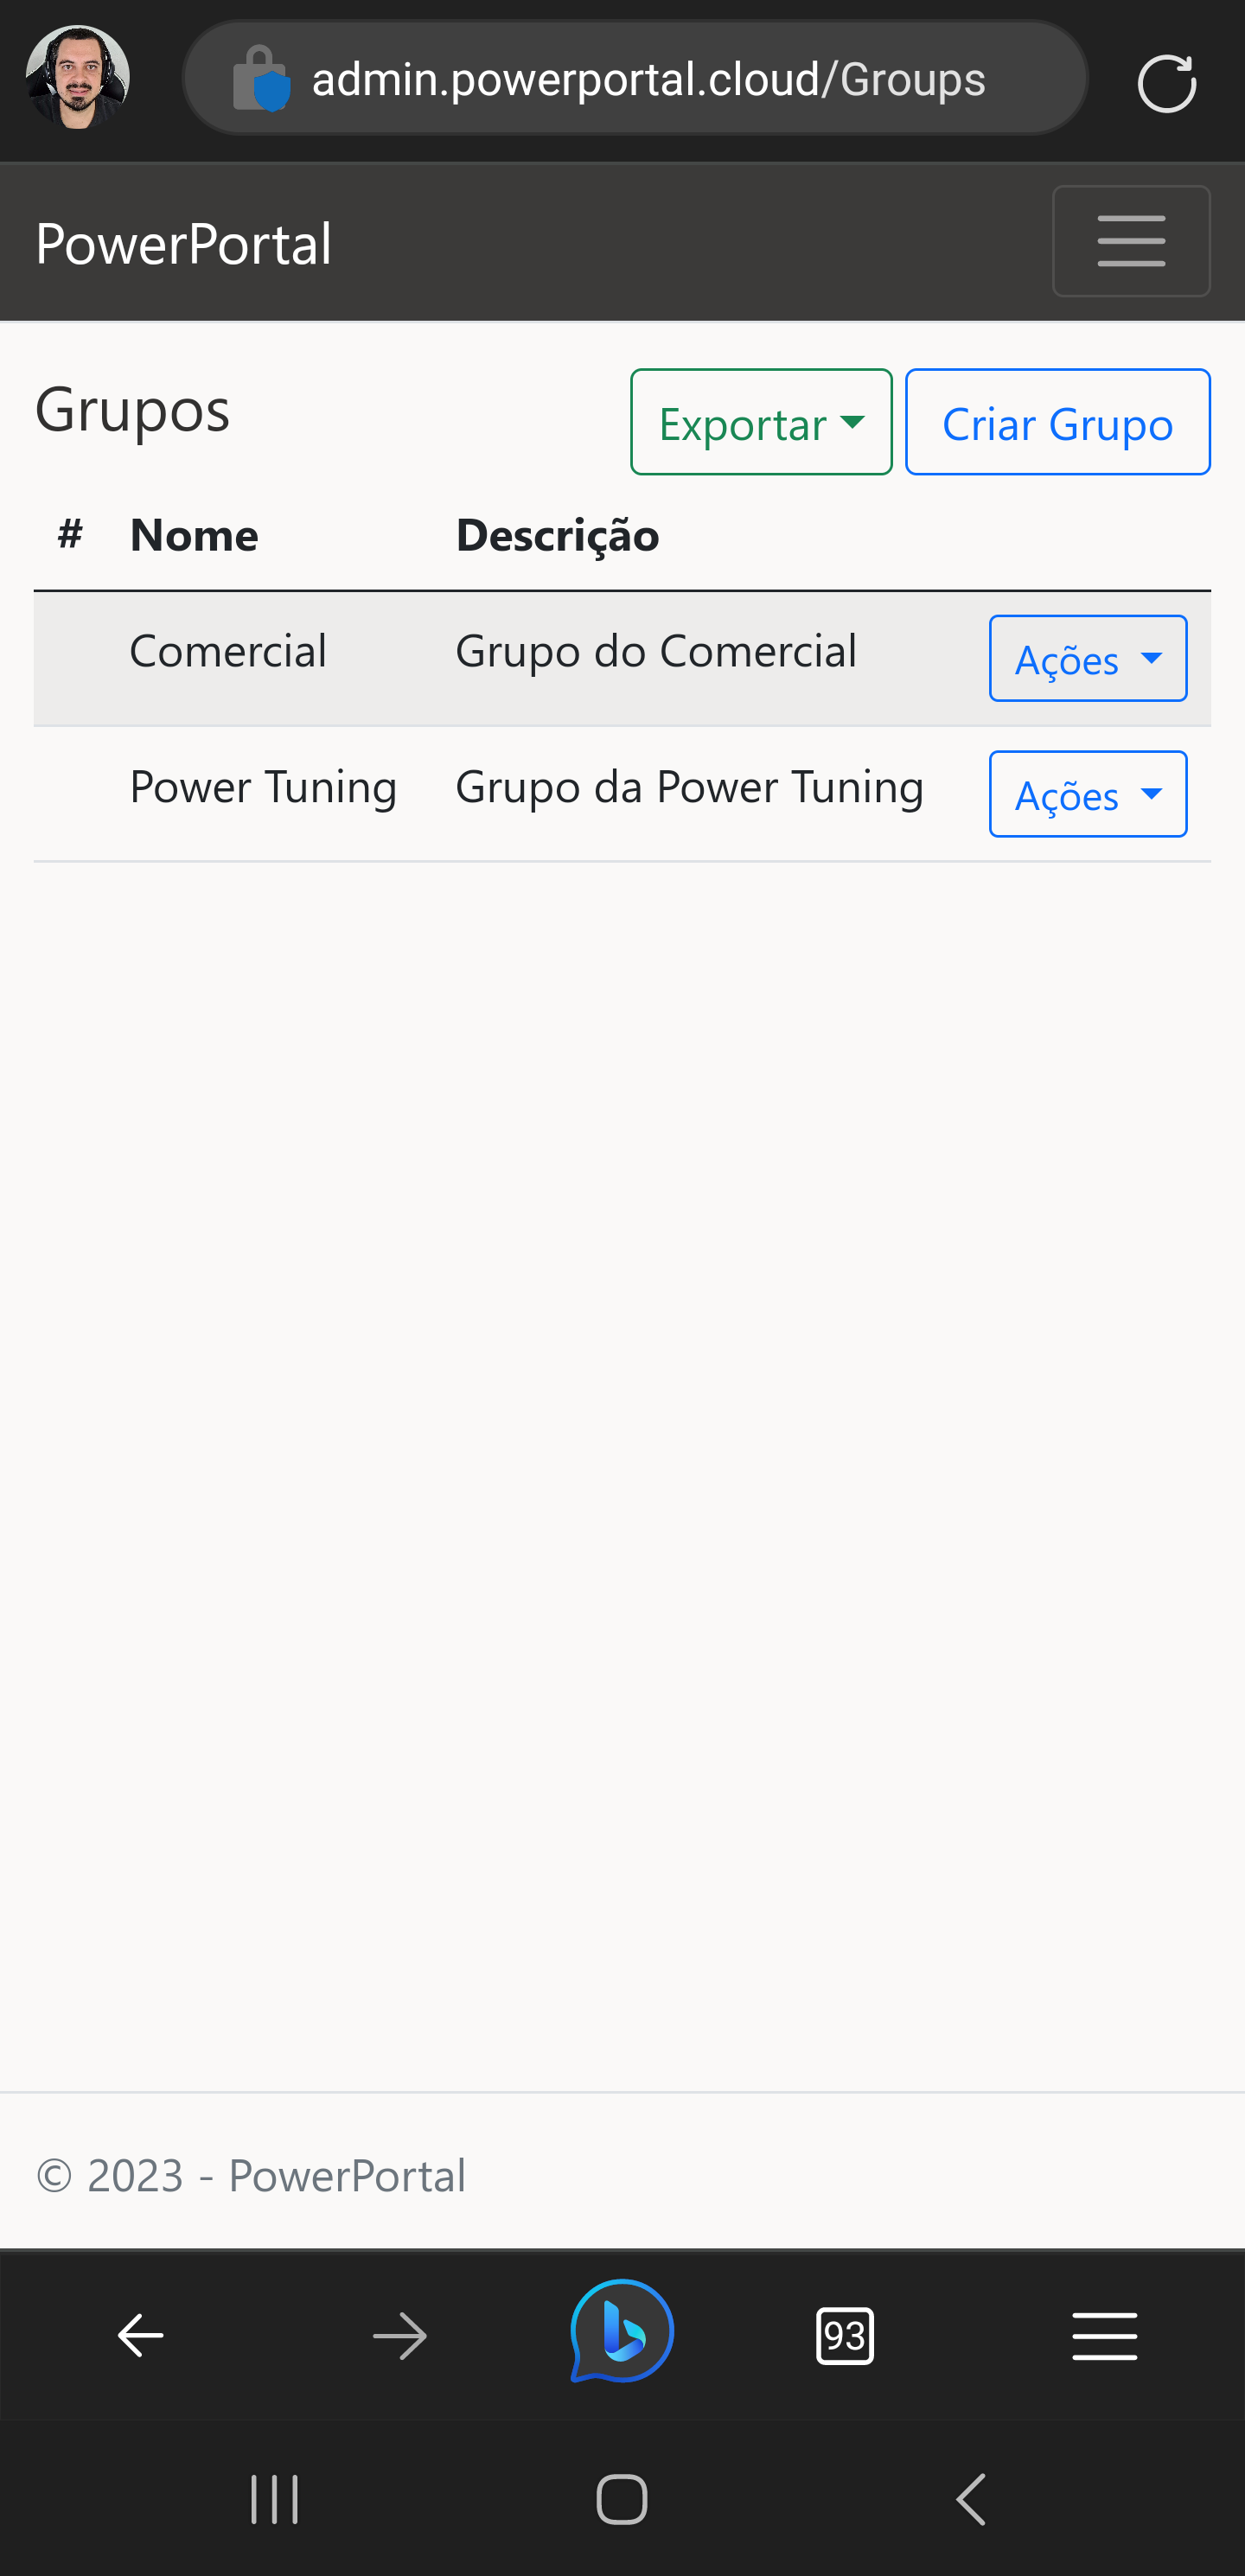 The administration portal has a responsive layout and can be accessed using any device:
– Computers (Windows, Linux, Mac)
– Smartphones (Android or iOS)
– Tablets (Windows, Android or iOS)
Manage your company's reports from anywhere, anytime, on any device.
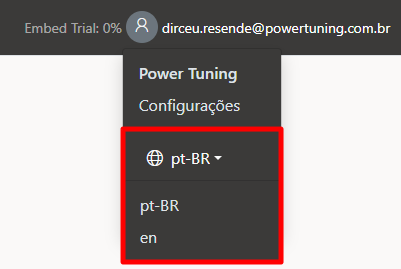
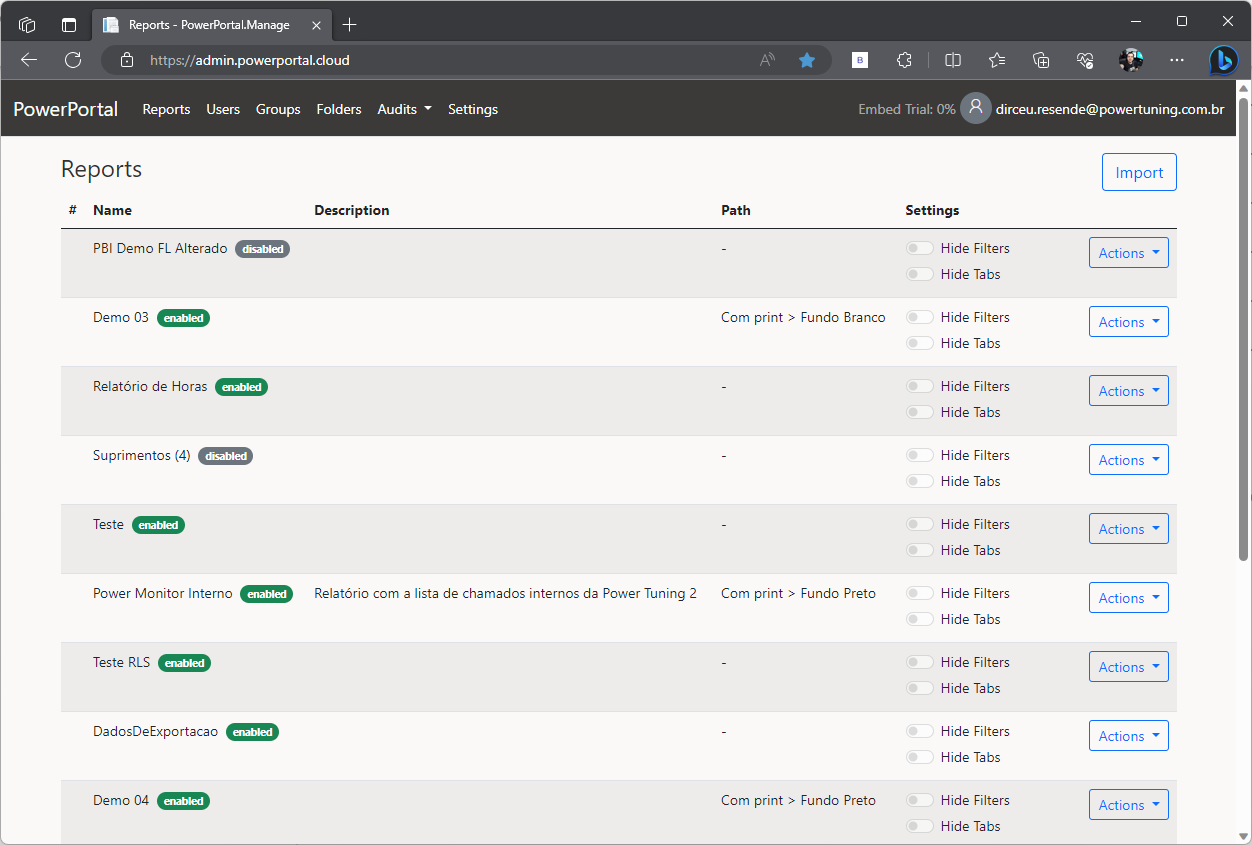
Power Embedded supports multi-languages in both the admin portal and the preview portal.
It doesn't matter what language your user or customer speaks, we can provide a smooth experience in your preferred language.
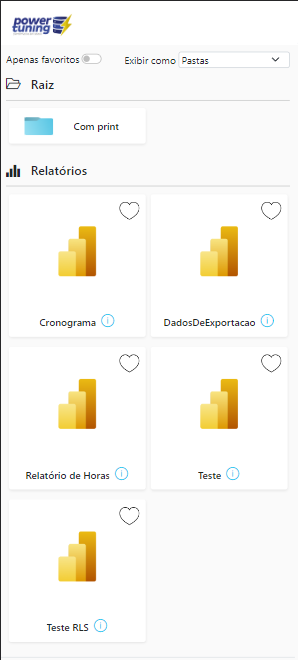
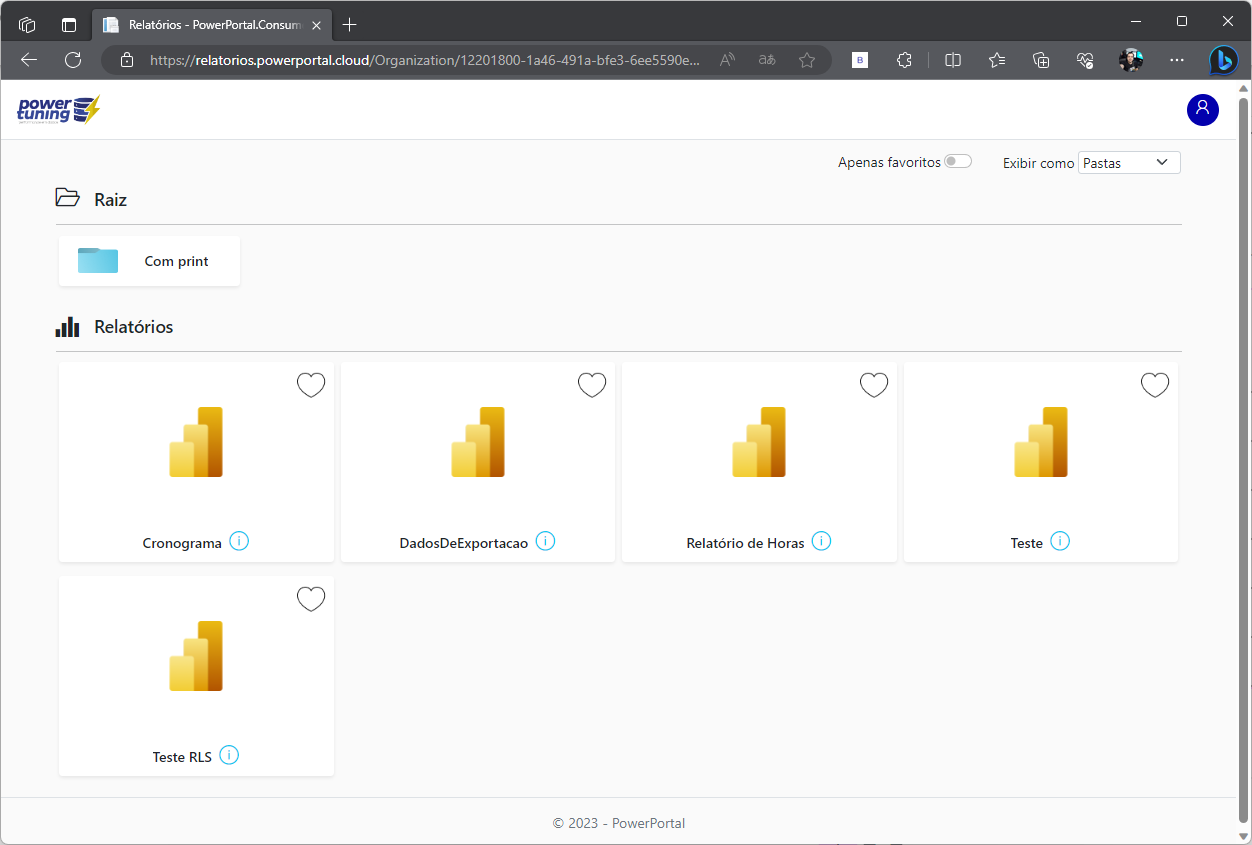 Just as Power BI Service has workspaces to group and organize reports, Power Embedded has the concept of folders.
Unlike Workspace, where you are only 1 level deep, in Power Embedded you can create N levels deep, with folders inside other folders.
Folders do not have permissions. If the user has access to one of the reports in the folder, he will see that folder. If he does not have access to any report in this folder, he will not see it.
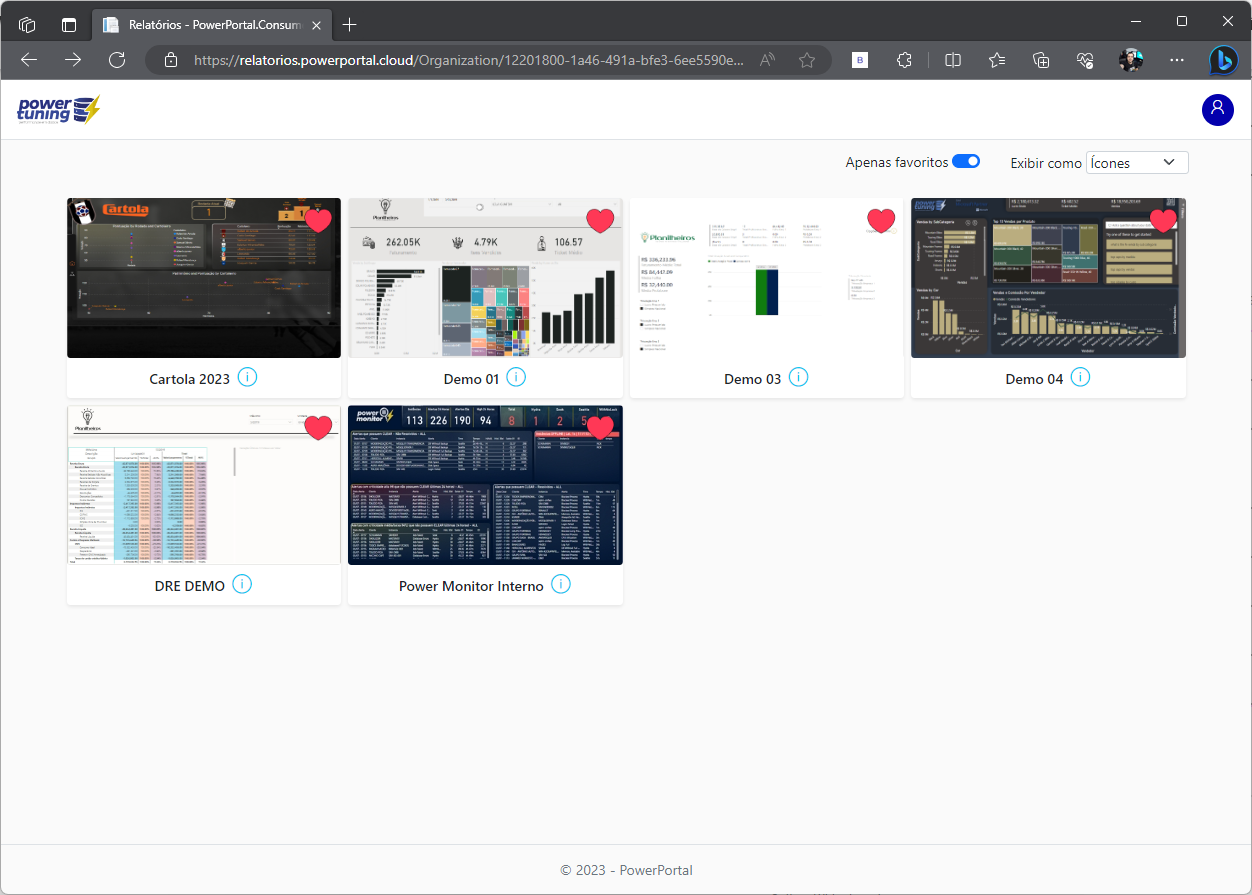
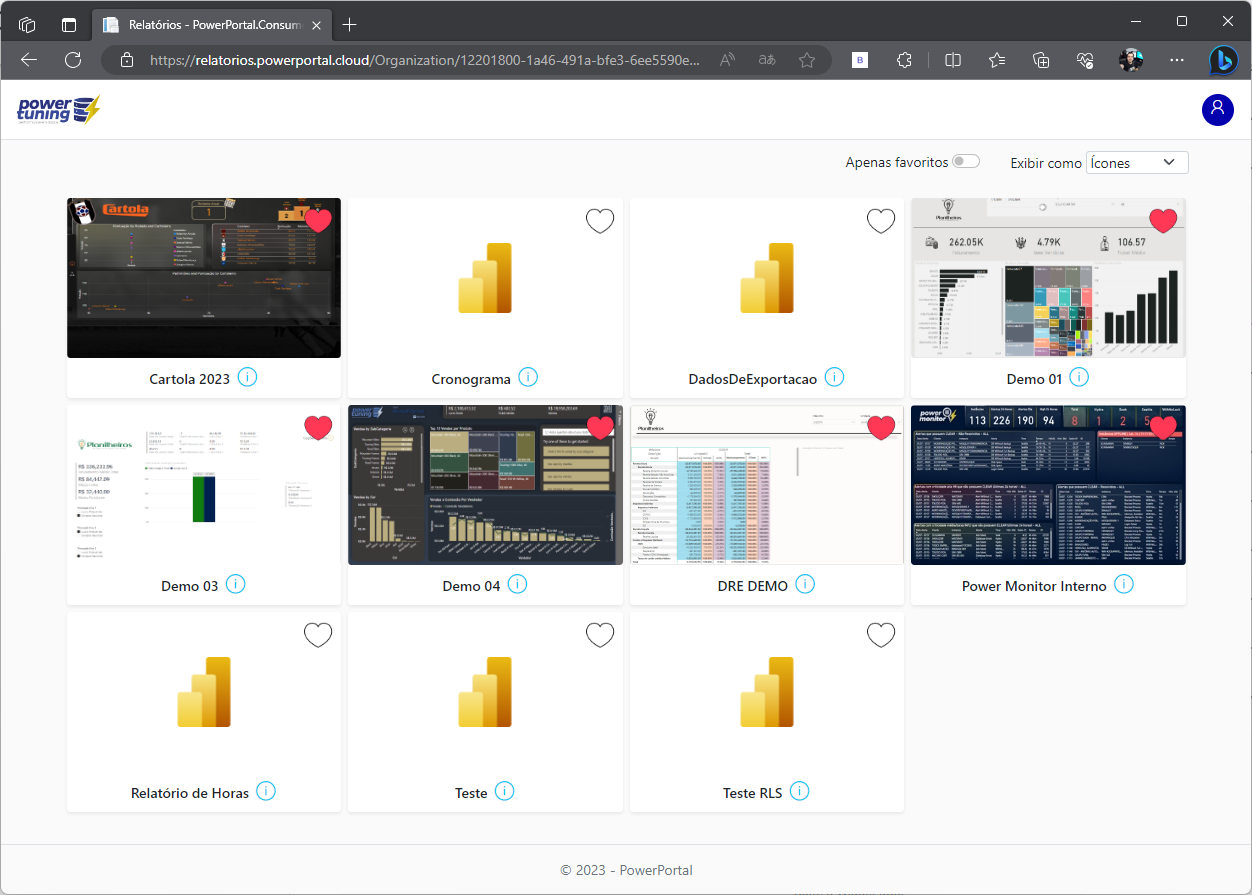 Different from the view of folders, where you have reports separated by folders and you navigate between folders, the view of Icons lists all the reports that the user has access to in a single screen.
This is very interesting for those users who would like to list all reports at once.
Just like the folder view, the icon view shows the thumbnail of the report, which can be used as a printout of the report home screen for easy previewing.
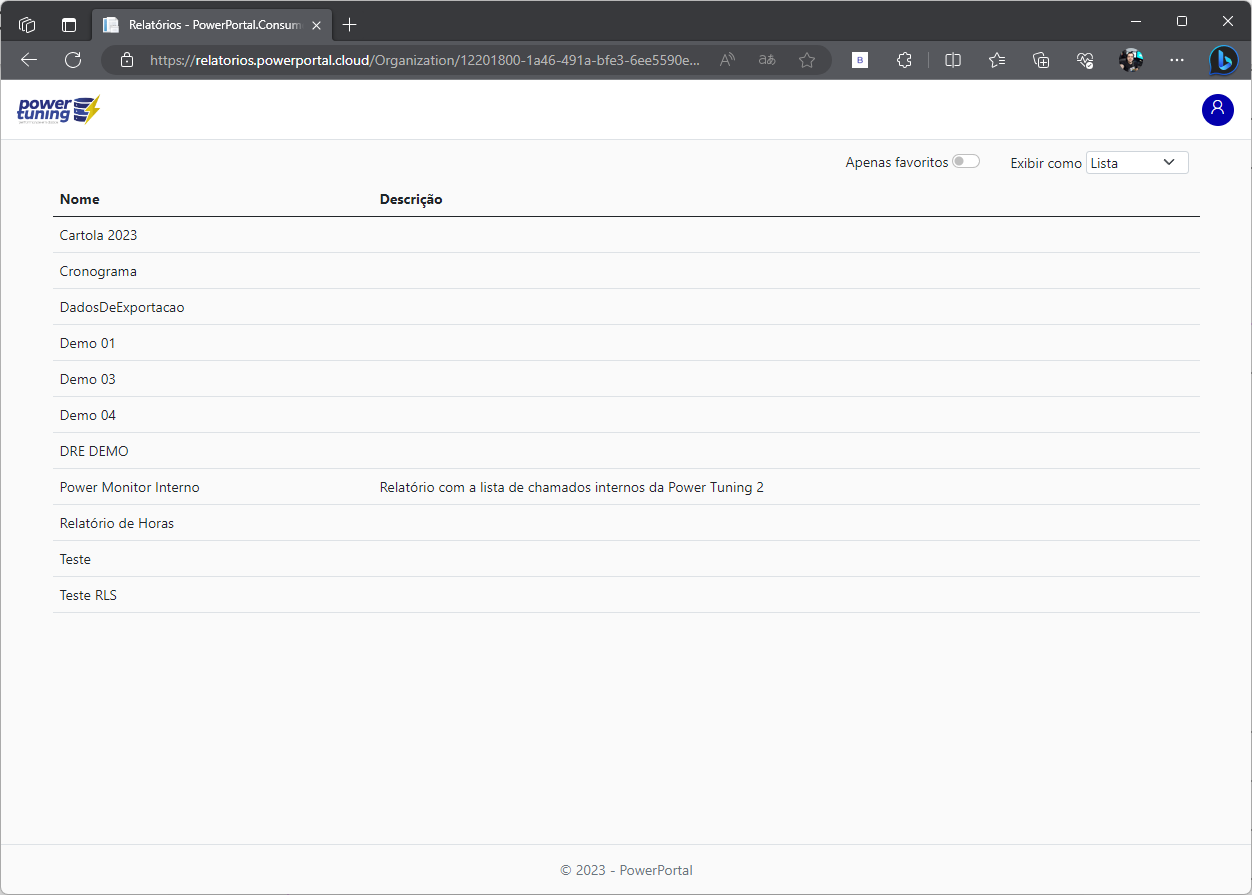 Like the icon view, the list view also “ignores” the folders and shows all the reports that the user has access to in a centralized view, but it is simpler than the icon view, as it does not show the thumbnails of the reports.
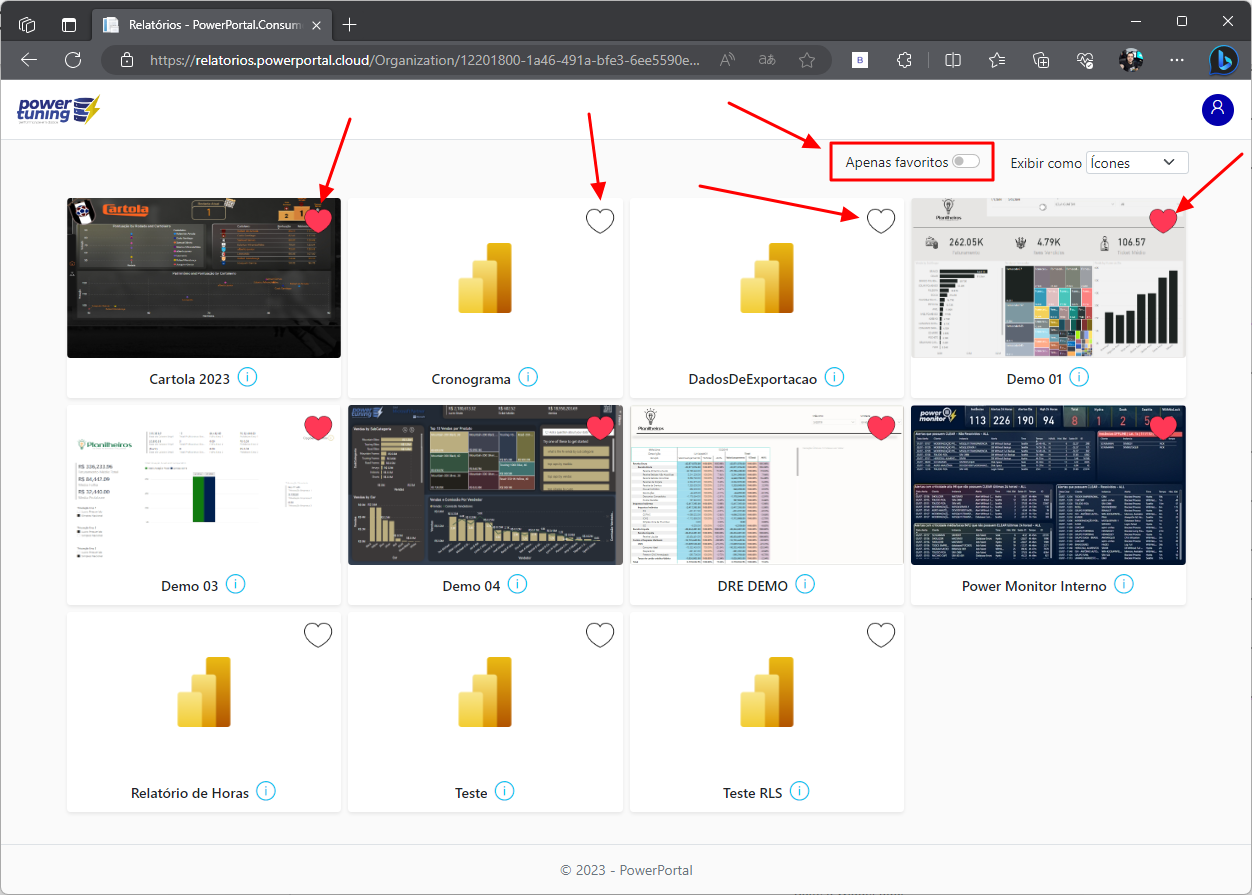 In the preview portal, user can define their favorite reports for easier and faster access.
To define favorite reports, just click on the heart icon in the upper right corner of each report.
To view the user's favorite reports, simply check the “Favorites only” selector and the portal will activate a filter and show only reports marked as favorites.
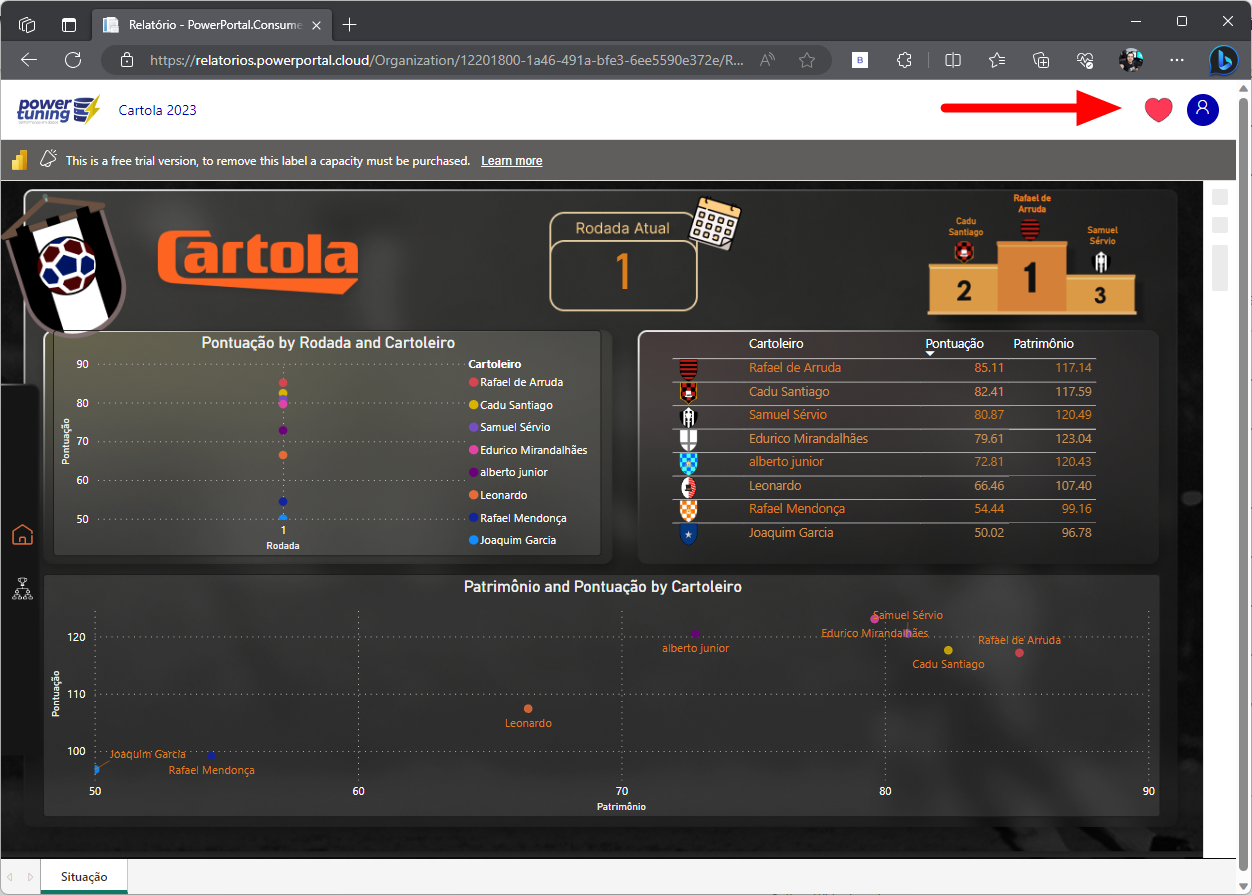 Another way to bookmark a report is to click on the red heart in the right corner of the navigation menu when you are accessing a report.
Once the option “Only favorites” is checked, the portal will only filter the reports that were marked as favorites.
Remember that this selector works in all viewing modes (List, Icons and Folders).
 Like the admin portal, the preview portal is also responsive and can be accessed from any device:
– Computer (Windows, Linux, Mac)
– Smartphone (Android, iOS)
– Tablet (Android, Windows, iOS)
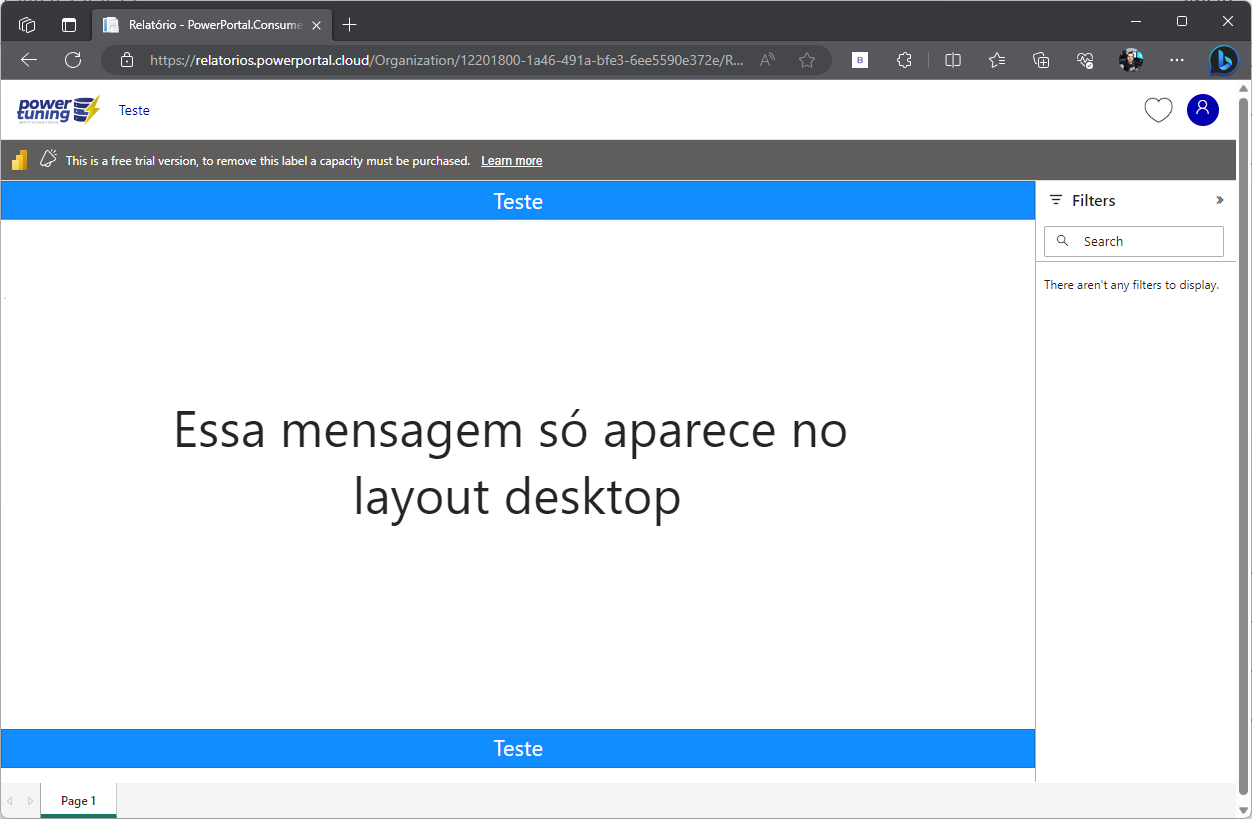
But it's not just the layout that's responsive!
If you're viewing the report on a desktop device, tablet, or flip your phone in landscape mode, you'll view the report in Desktop mode, using the default layout you create in Power BI Desktop.
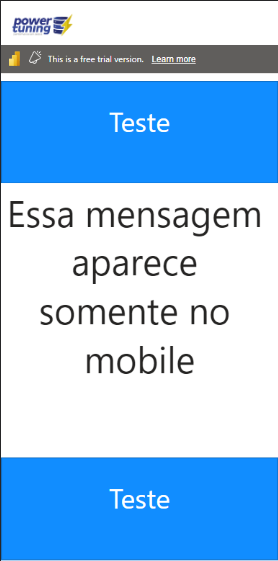
 If you're viewing through a smartphone, in portrait mode, you'll see the mobile-optimized layout, which you can customize through Power BI Desktop.
 Row Level Security (RLS – Row Level Security) is a fundamental part of BI reports, allowing the same report to serve data to different groups, profiles or people, avoiding development and maintenance effort when having to create several reports for this.
In Power Embedded, this works in a very simple and transparent way: Just create the RLS rules normally in your report, using Power BI Desktop, and in the report registration, in the administrative portal, inform the name of the role(s) in the RLS field.
Power Embedded will send the email of the user accessing the report and the RLS rules will be applied by Power BI itself.
Following good practice in RLS development, the ideal is to use dynamic RLS, where a dataset table will contain the relationship between the user and the data that will be filtered. This improves the rule's performance and also ease of maintenance, which will only occur at the data level and no longer in the structure of the report or dataset.
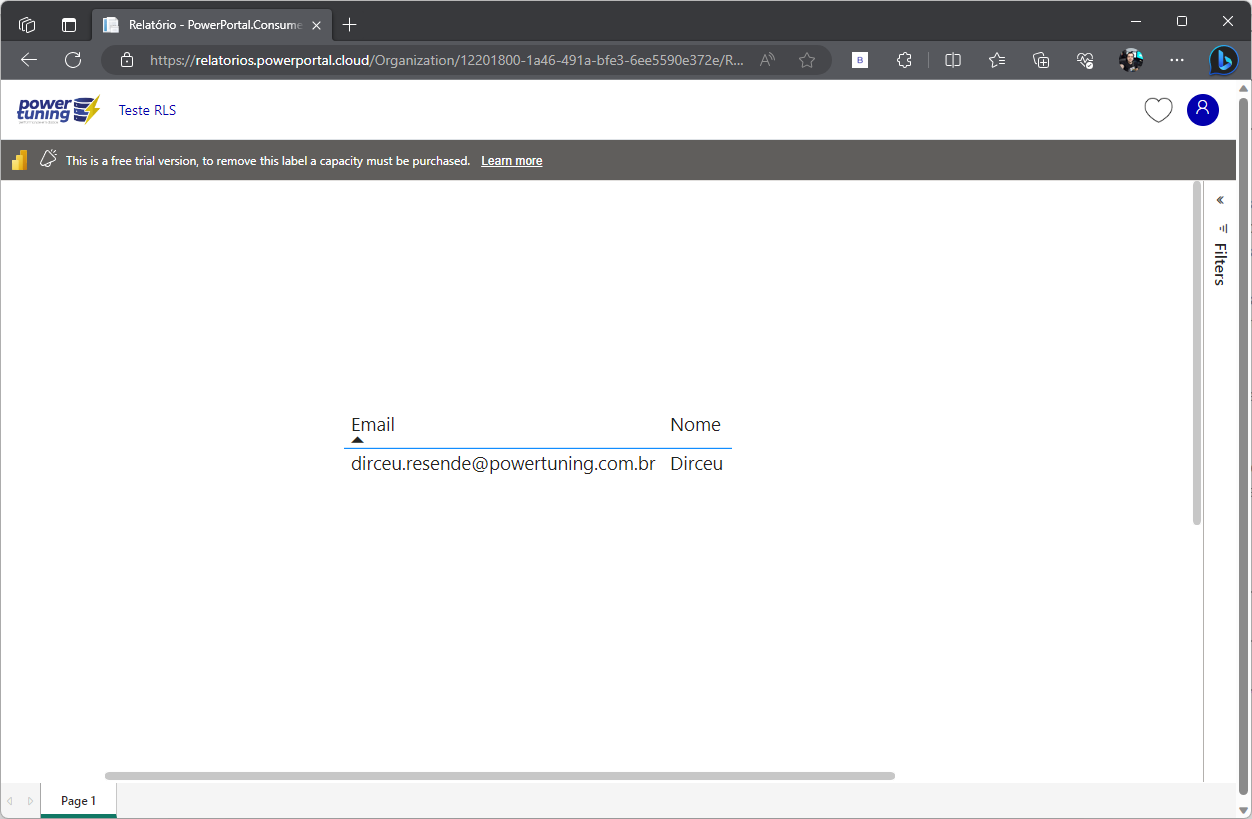
Power Embedded - RLS up and running
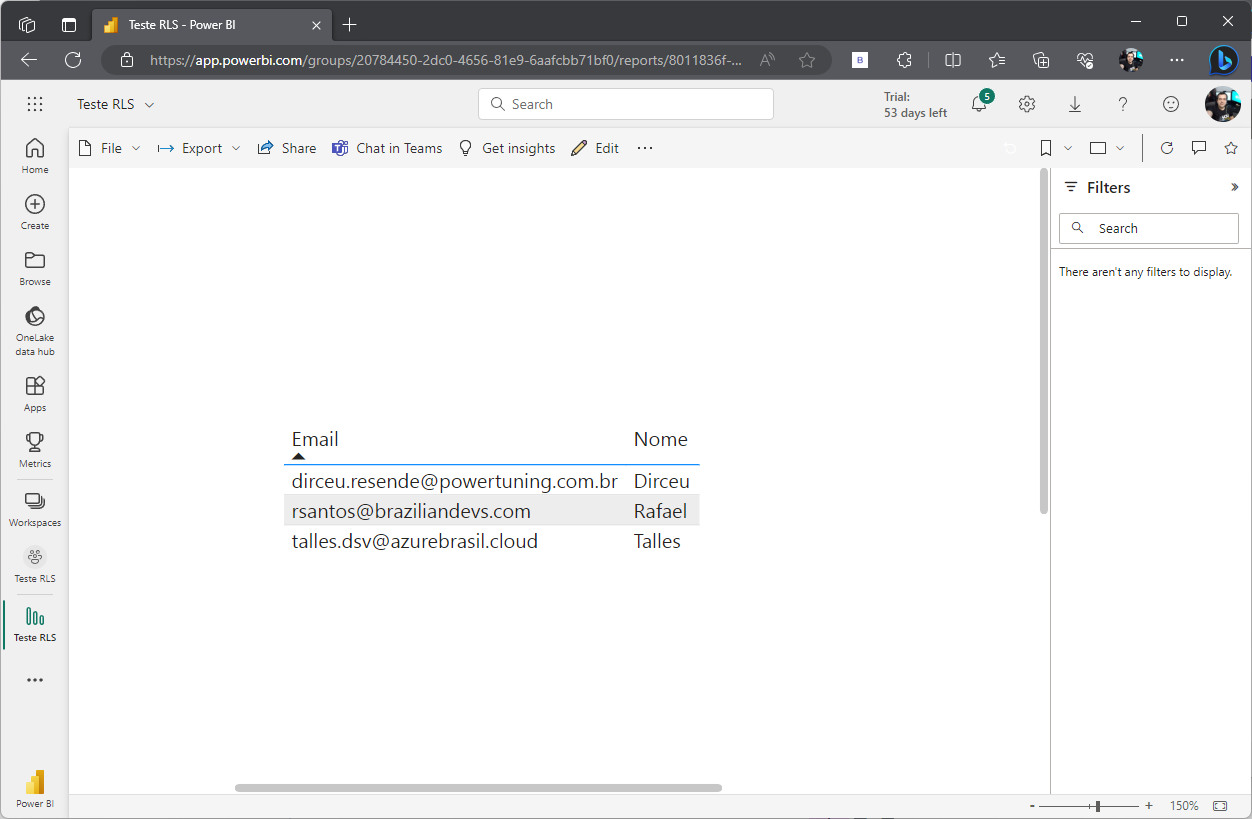
Power BI Service - No RLS configured
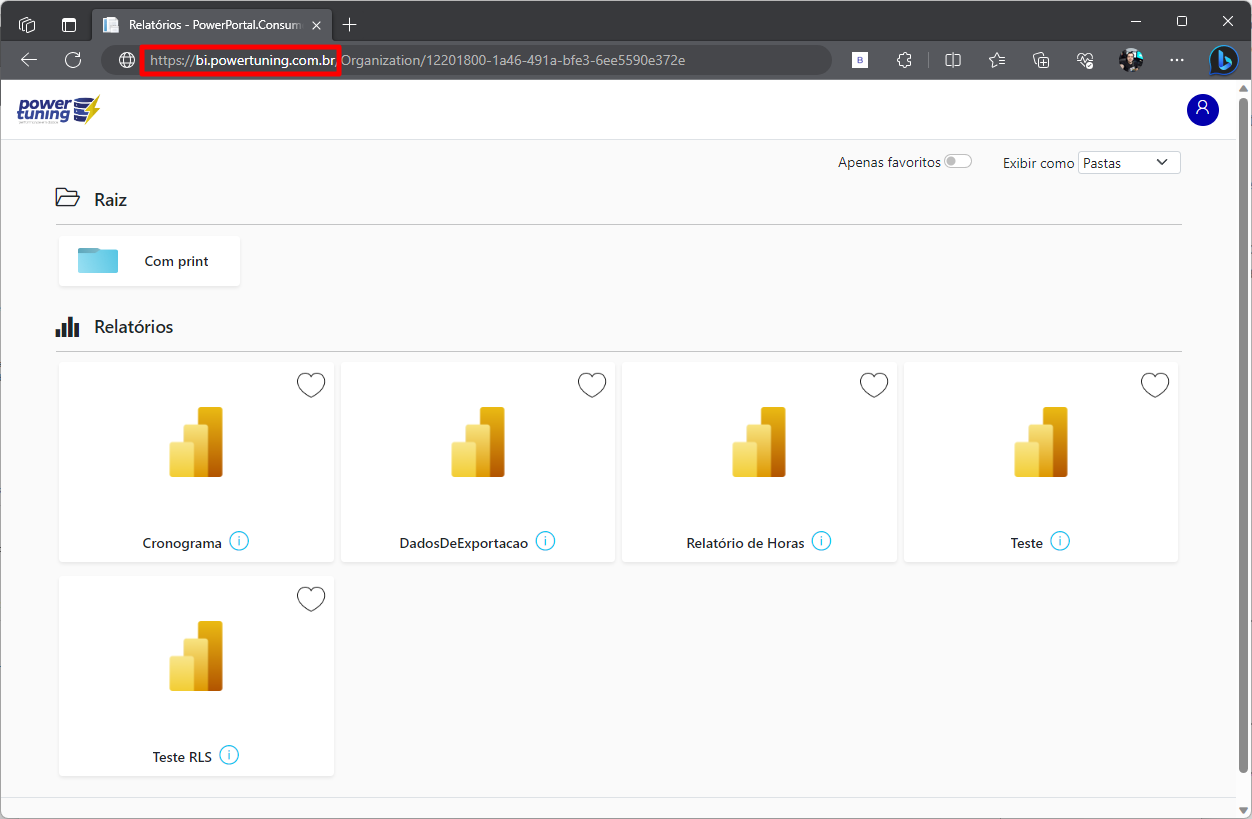 Use your company's own domain to access reports.
Instead of accessing the powerbi.com address, which has no connection with your company, using Power Embedded, your users and/or customers can access your reports using a customizable address such as: reports.yourcompany.com
Much more customizable, easy to remember and adhering to the company's identity.
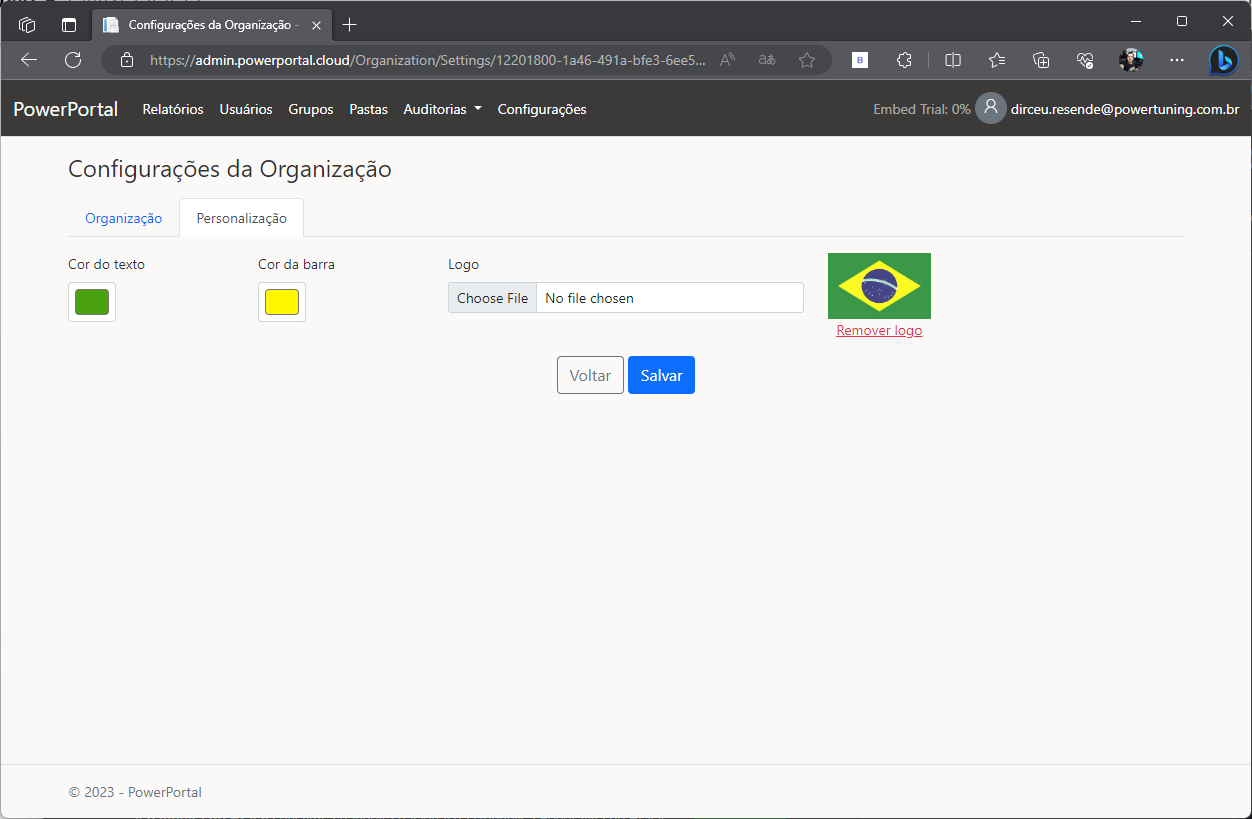 Customize the portal using your company's logo and colors!
Instead of using a standard Microsoft portal, the same for all customers, leave the portal with your company's face and visual identity.
You define the colors and the logo through the Administration Portal.
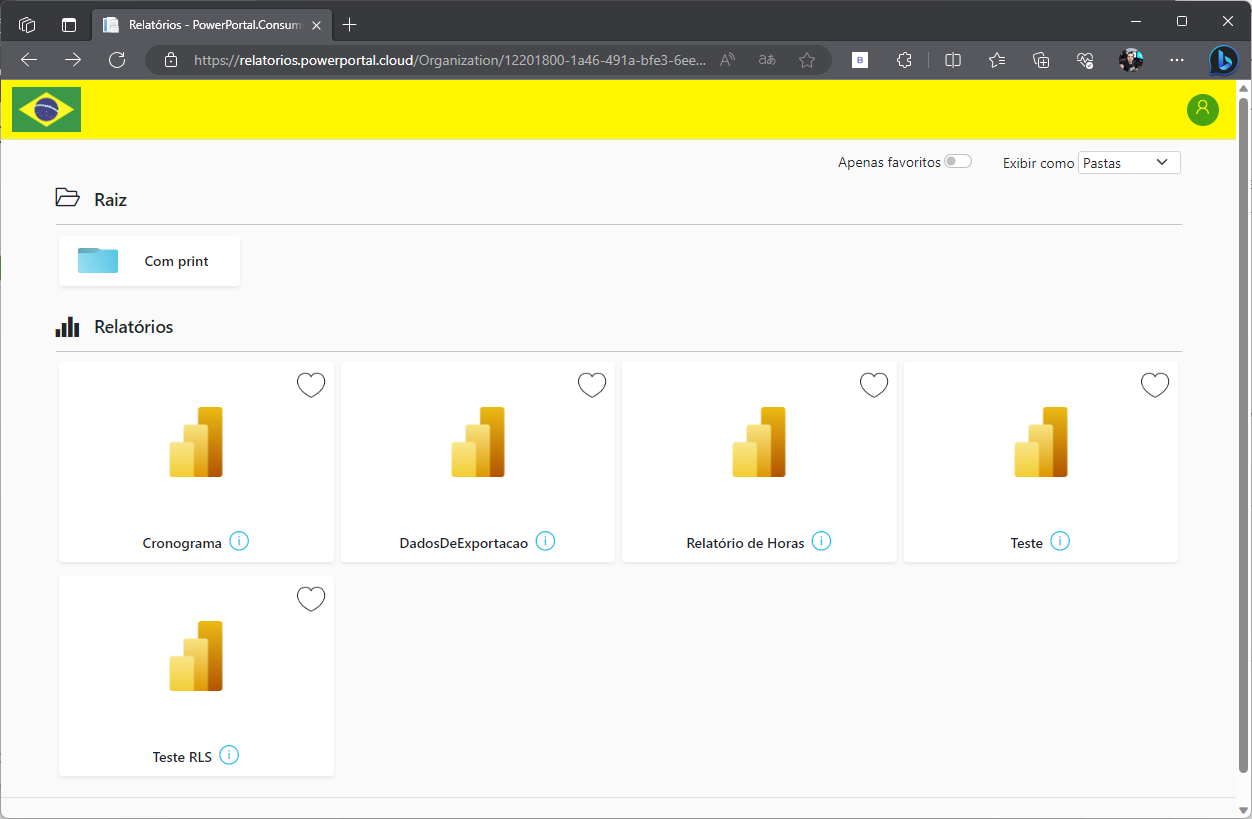
And view changes through the View Portal, where users and/or customers will access published and imported reports.